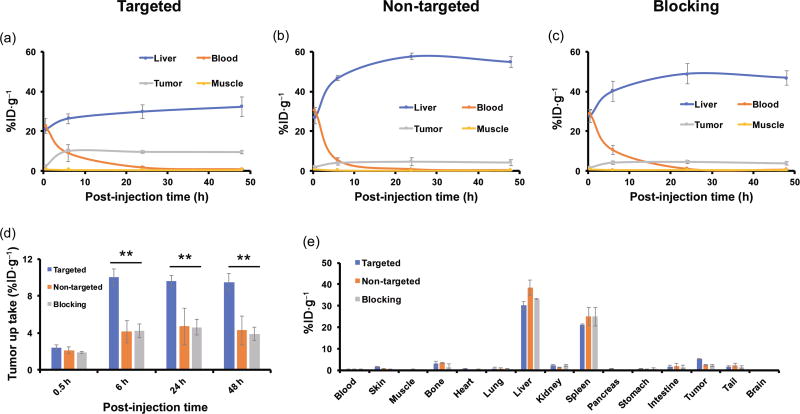
Figure 6.
Quantitative ROI analysis of the PET imaging data and ex vivo biodistribution studies. Time–activity curves of the liver, blood, 4T1 tumor, and muscle upon intravenous injection of (a) UCNP@[89Zr]HMSN-PEG5k-TRC105, (b) UCNP@[89Zr]HMSN-PEG5k, or (c) UCNP@[89Zr]HMSN-PEG5k-TRC105 after a blocking dose (1 mg per mouse) of TRC105. (d) Comparison of 4T1 tumor uptake among the three groups. The difference in 4T1 uptake between UCNP@[89Zr]HMSN-PEG5k-TRC105 and the two control groups was statistically significant (**p < 0.005). (e) Biodistribution comparison in 4T1 tumor-bearing mice at 48 h p.i. All data represent three mice per group.

