
Figure 6. Crh+ PMC neurons receive converging inputs from multiple brain regions.
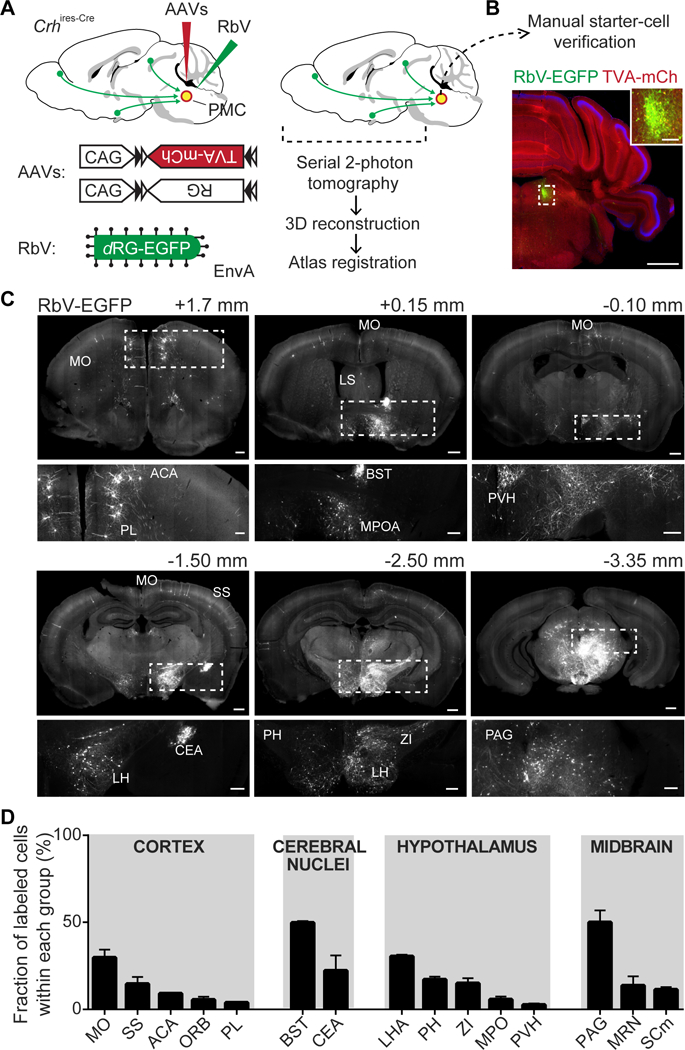
A, Schematic of rabies-based monosynaptic retrograde transsynaptic tracing from Crh+ PMC neurons. PMC of Crhires-Cre mice was transduced unilaterally with 2 Cre-dependent AAVs encoding TVA-mCherry fusion protein (TVA-mCh) and rabies virus glycoprotein (RG), followed 3 weeks later by EnvA-pseudotyped, glycoprotein-deleted (ΔRG) EGFP expressing rabies virus (RbV). After the rabies injection, the front part of the brains were embedded in agarose, imaged under serial 2-photon tomography (STP) system, reconstructed in 3D, and registered to a reference atlas for analysis.
B, Brainstem sections containing the PMC were manually sliced and examined to identify starter cells in the injection site and to detect potential viral leak into nearby areas. Example starter cells in PMC infected with both AAVs and RbV (yellow, enlarged in the inset). Scale bar: 1 mm, 125 μm in the inset.
C, Representative coronal sections of RbV labeled cells displayed from anterior to posterior. RbV-EGFP expressing cells reveal candidate areas projecting directly to Crh+ neurons in PMC. Approximate distances from the bregma are shown above the top panels. Regions inside the white dotted boxes are magnified and displayed in the bottom panels. MO: Motor Cortex, ORB: Orbitofrontal Cortex, ACA: Anterior Cingulate Cortex, PL: Prelimbic Cortex, LS: Lateral Septum, SS: Somatosensory Cortex, BST: Bed Nuclei of Stria Terminalis, MPOA: Medial Preoptic Areas, PVH: Paraventricular Hypothalamic Nucleus, LHA: Lateral Hypothalamus, ZI: Zona Incerta, CEA: Central Amygdalar Nucleus, PH: Posterior Hypothalamus, PAG: Periaqueductal Gray, SCm: Superior Colliculus (motor related), MRN: Midbrain Reticular Nucleus. Scale bar: 500μm in the upper panels, 250μm in the lower panels. The images in the top row are shown on the same gray scale. The contrast of each image in the bottom row has been adjusted to highlight cell bodies.
D, The distribution of candidate neurons presynaptic to Crh+ PMC neurons, shown as percentage of the total labeled cells with each group (Cortex, Cerebral Nuclei, Hypothalamus, and Midbrain). Mean ± SEM.