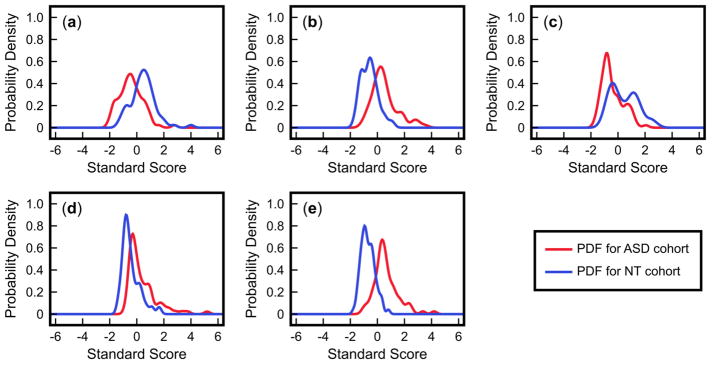
Figure 4.
Probability density functions (PDFs) of five measurements for ASD and NT cohorts from the IMAGE study: (a) % DNA methylation; (b) 8-hydroxyguanosine; (c) glutamylcysteine; (d) free cystine/free cysteine; (e) % oxidized glutathione. These PDFs are based on the standardized values of each measurement (i.e., all samples for a measurement are scaled such that the mean value is 0 and the standard deviation is 1).

