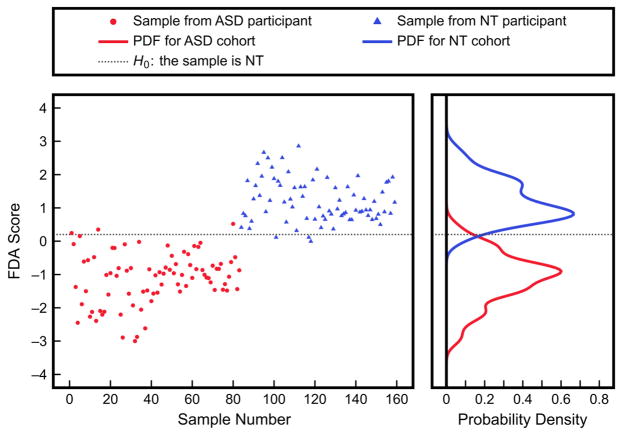
Figure 5.
Multivariate analysis with FDA using five measurements from the IMAGE study (% DNA methylation, 8-hydroxyguanosine, glutamylcysteine, free cystine/free cysteine, and % oxidized glutathione). The scores are the projected values obtained by leave-one-out cross-validation with FDA, while the PDFs were obtained by fitting to the scores. The shown threshold corresponds to a Type I error of 4.8% and a Type II error of 5%.

