
Figure 5. Presence of host cells in ECM hydrogel.
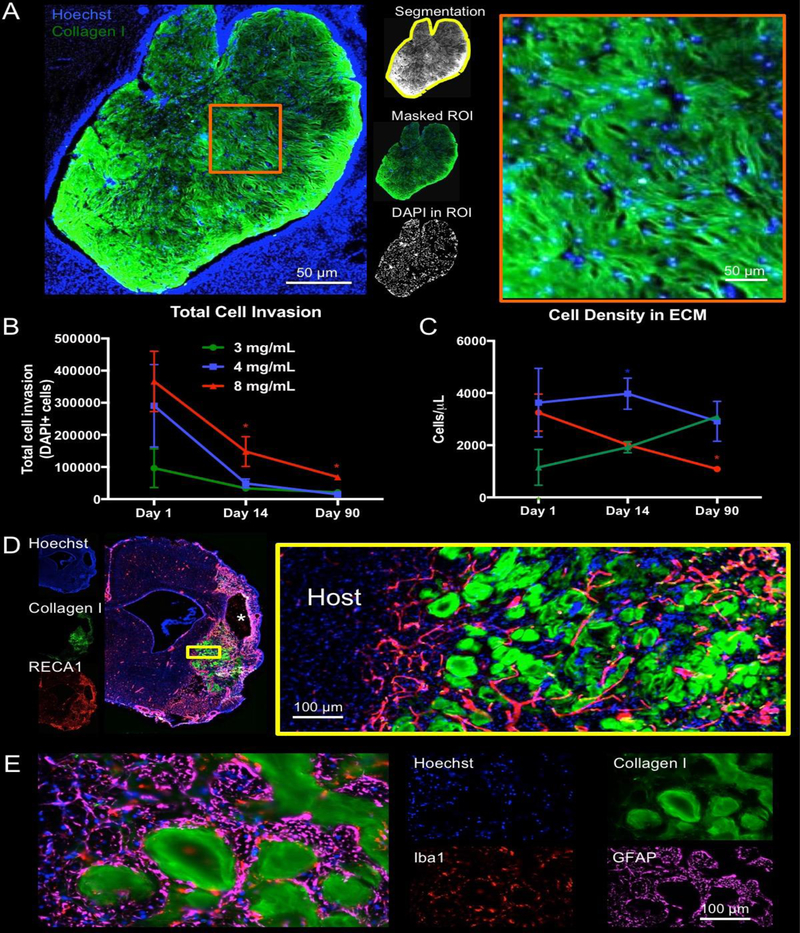
A. Using collagen I staining, a region of interest (ROI) was defined around the edges of the biomaterial (8 mg/mL shown) and applied to the DAPI image to provide a quantification of the number of cells present within the hydrogel. B. Total cell infiltration indicated that the 8 mg/mL hydrogel consistently contained the highest number of cells. In all conditions, a gradual decrease in total number of cells is seen that is related to the biodegradation of the scaffold. C. To account for ECM hydrogel volume changes due to biodegradation, cell density was calculated. The 4 mg/mL hydrogel concentration provided a very consistent density of approximately 4000 cells/μL. Cell density for the 8 mg/mL decreased from a 4 mg/mL comparable level, whereas 3 mg/mL increased to a comparable level at 90 days. These cell density dynamics reveal key differences in the inductive potential of ECM hydrogel concentrations. D. Cell infiltration and density here focus on the bioscaffold content (4 mg/mL shown). However, a significant number of cells are evident within the previous cavity in between patches of ECM hydrogel. E. Iba-1+ macrophages and GFAP+ astrocytes are common phenotypes, but no scar or foreign body response was evident. (* p<0.05)