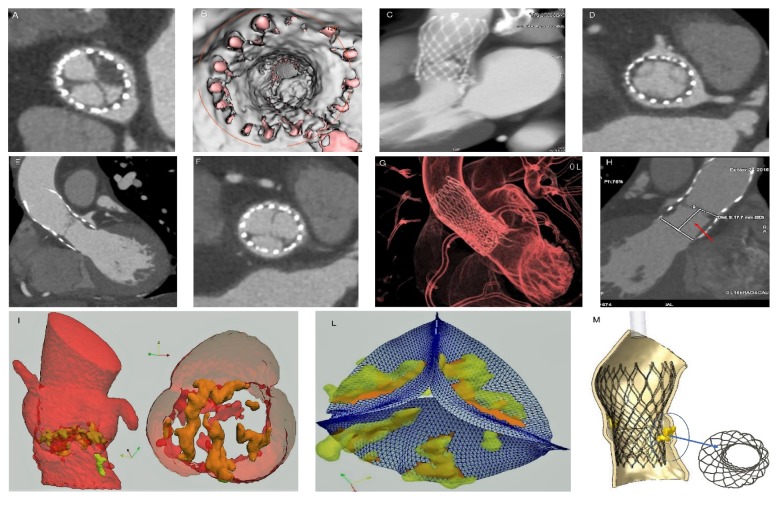
Figure 4.
Biomodelling of the TAVR with T HVT and dislodgment. Panels A, B, and C: postoperative CT scan at 1 year shows obstruction of TAVR. The thrombus is located at the level of the posterior and anterior-right leaflet with partial extensions into the supravalvular zone. The posterior leaflet is subtotally fixed in closed position with a planimetry of 1.5 cm2. The thrombus is extended to the outer surface of the CoreValve involving the sinus of Valsalva. The coronary ostia were free of lesions and there was no suggestion of embolism. Panel D and E: partial THVT. The thrombus is predominantly organized on the posterior leaflet as a nodular formation (4-4, 5 mm). Panel F and G: CT scan 4 weeks after anticoagulation shows regression of THVT with normal cusps. Panel H: TAVR with THVT and dislodgment. Panel I and L: root and leaflet calcification after extraction through FEA. Panel M: TAVR simulation showing refractory native calcification, stent distortion, and incomplete deployment of core valve 26 mm.

