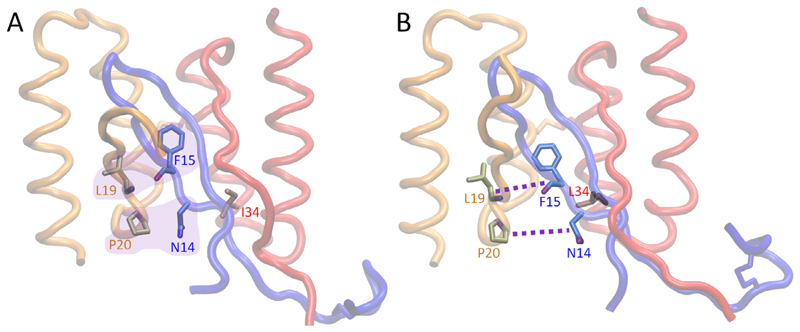
Fig. 5.
Molecular graphics images of (A) HI18 and (B) ZAβ3_A10E in complex with IAPP. These two β-wrapins only differ at residue position 34, which is Ile in HI18 and Leu in ZAβ3_A10E. (A) Favorable interactions occurring in the HI18:IAPP complex are encapsulated in purple. (B) Weakened interactions occurring in the ZAβ3_A10E: IAPP complex are indicated with purple dotted lines between the two interacting residue pairs. β-Wrapin subunits 1 and 2 are shown in red and orange tube representation, respectively, and IAPP is shown in blue tube representation. Red, orange, and blue labels indicate residues of subunit 1 of the β-wrapin, subunit 2 of the β-wrapin, and IAPP, respectively. (For interpretation of the references to colour in this figure legend, the reader is referred to the web version of this article.)

