
Figure 1:
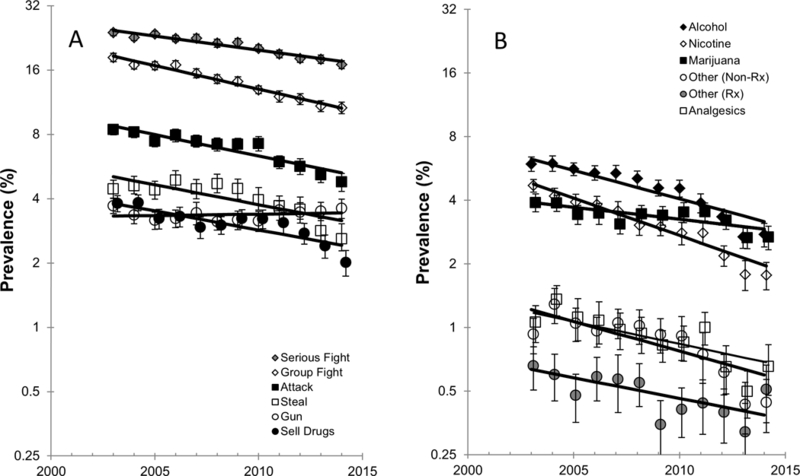
Prevalence by year for each of 6 delinquent behaviors A), and each of SUD categories (B). Trend lines represent fits to log-binomial models of each variable as a function of year. Error bars represent 95% confidence intervals. Y-axes are logarithmically scaled.