
Figure 2:
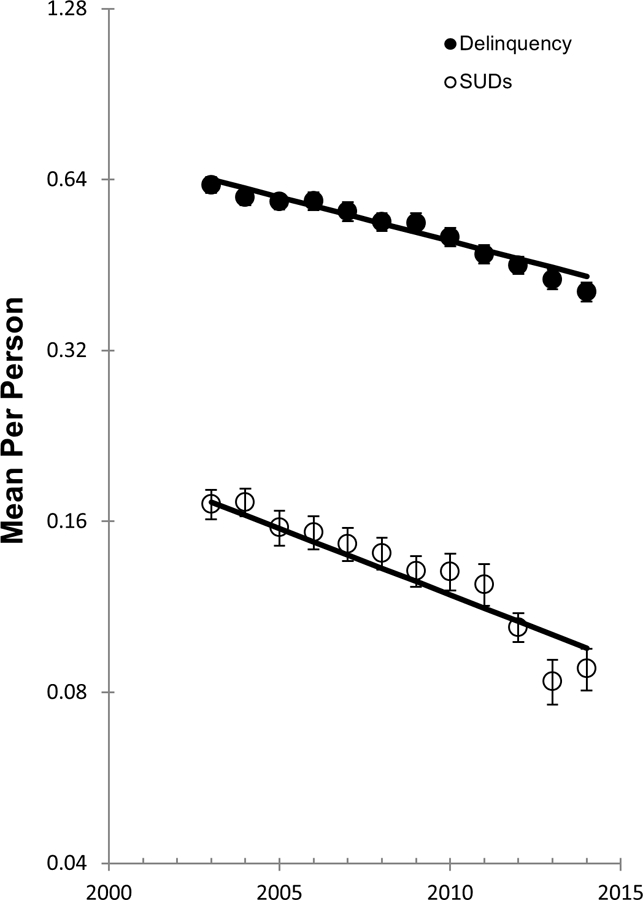
Mean by year for average number of delinquent behaviors and SUDs per person. Trend lines represent fits to log-binomial model. Error bars represent 95% confidence intervals. Y-axis is logarithmically scaled.
Official websites use .gov
A
.gov website belongs to an official
government organization in the United States.
Secure .gov websites use HTTPS
A lock (
) or https:// means you've safely
connected to the .gov website. Share sensitive
information only on official, secure websites.
Mean by year for average number of delinquent behaviors and SUDs per person. Trend lines represent fits to log-binomial model. Error bars represent 95% confidence intervals. Y-axis is logarithmically scaled.