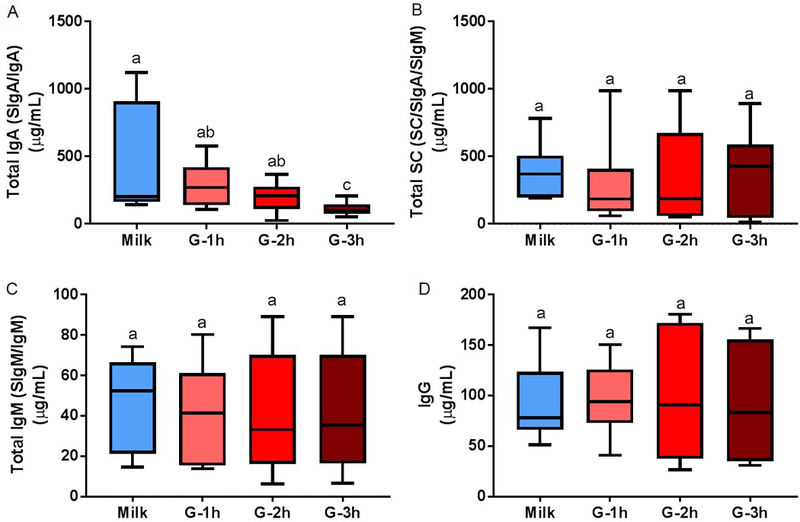
Fig. 3.

Concentration of immunoglobulin (Ig) in human milk and preterm infant gastric samples at 1 (G-1h), 2 (G-2h) and 3 h (G-3h) after the beginning of feeding. Concentrations of (A) total IgA (secretory IgA (SIgA)/IgA), (B) total secretory component (SC/SIgA/SIgM), (D) total IgM (secretory IgM (SIgM)/IgM) and IgG were determined by ELISA. Paired milk and gastric samples were collected in preterm infants (23–32 wk of gestational age (GA) and 7–98 days of postnatal age). Letters a, b and c show statistically significant differences between groups (p < 0.05) using one-way ANOVA with repeated measures followed by Tukey’s multiple comparison tests. Values are min, median and max, n = 11.
