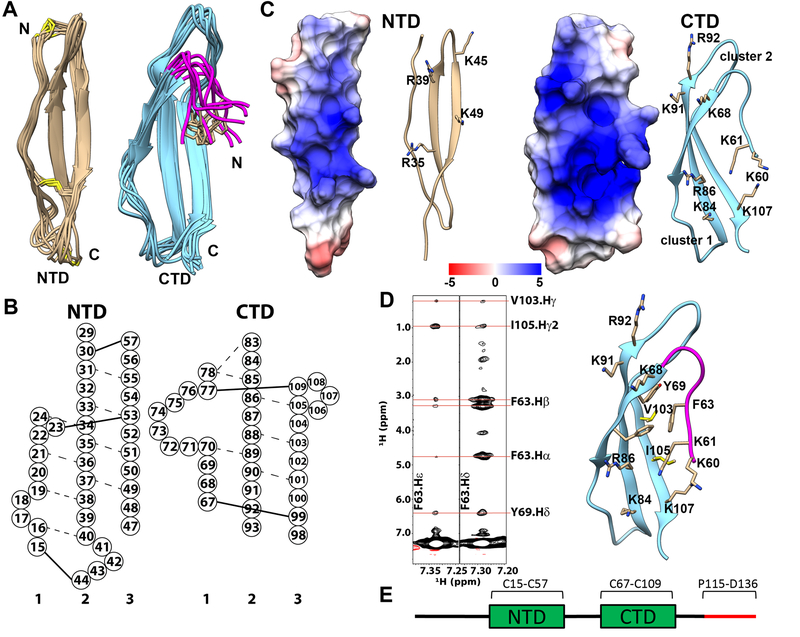
Figure 1.
Structure of PTN. A) Superimpositions of NTD and CTD/hinge from the ensemble of 10 lowest energy structures. Disulfide bonds are represented in yellow. Hinge segment is shown in magenta. Side chain of F63 is shown in beige. B) Schematic depiction of the β-sheet structures of PTN. Residues are represented by circles labeled with residue numbers. Dashed lines represent observed NOE between amide protons. Solid lines represent disulfide bonds. C) Electrostatic potential mapping of NTD and CTD/hinge. The surface depiction of these domains are shown in the same orientation as the ribbon diagrams to their right. The unit of potential is in kT/e. D) Left: strips from aromatic 13C-edited NOESY showing NOE cross peaks between aromatic protons of residue F63 in the hinge and Y69, V103, I105 in CTD. Right: structural details of interactions between hinge and CTD. E) Schematic of the PTN sequence. The C-terminal tail is shown in red.

