Figure 4.
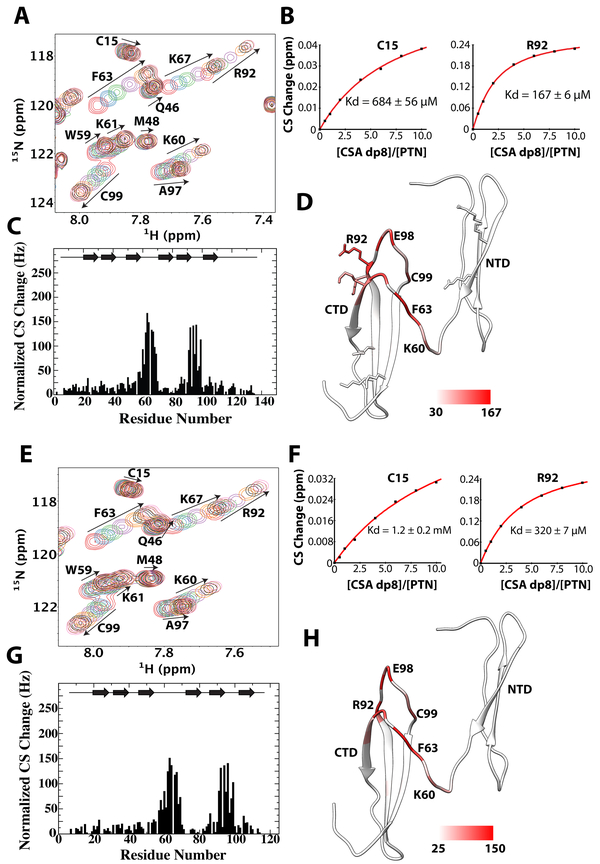
Titration of wild type and C-terminal truncated PTN with CSA dp8. A) 15N-edited HSQC overlay of wild type PTN at different concentrations of CSA dp8. Residues with large chemical shift changes are labeled and their movements are illustrated with arrows. B) Normalized CSA dp8-induced chemical shift changes for each residue in wild type PTN. Schematic illustration of PTN’s secondary structure is shown on the top of the plot. C) Binding curves of residues C15 (NTD) and R92 (CTD) used to calculate the CSA dp8 binding Kd of each domain. D) Magnitudes of chemical shift perturbation mapped onto the ribbon diagram of PTN. Coloring scale is shown on the bottom. E) 15N-edited HSQC overlay of C-terminal truncated PTN (residues 1 to 114) at different concentrations of CSA dp8. F) Normalized CSA dp8-induced chemical shift changes of amide proton and nitrogen for each residue in C-terminal truncated PTN. G) Binding curves of residues C15 (NTD) and R92 (CTD) used to calculate the CSA dp8 binding Kd of each domain. H) Magnitudes of chemical shift perturbation mapped onto the ribbon diagram of PTN. Coloring scale is shown on the bottom.

