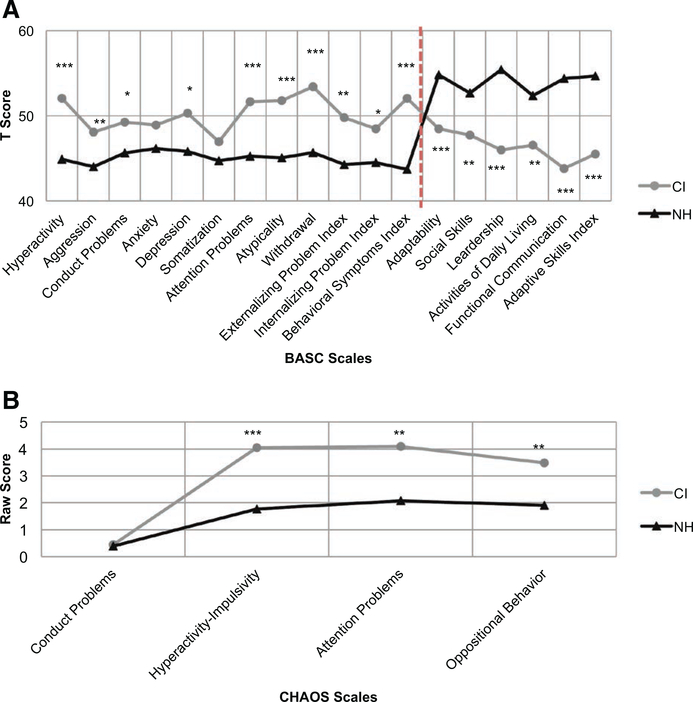
Figure 1.
Group difference in psychosocial outcomes. A, BASC parent-reported scales that significantly differ between CI and NH participants (collapsed across age). N = 57 CI users and N = 53 NH peers. Higher t scores on scales constituting the externalizing problem index, the internalizing problem index, and the behavioral symptoms index indicate behavioral deficits (scales to the left of vertical dashed line). Lower t scores on scales constituting the adaptive skills index indicate maladaptive behaviors (scales to the right of vertical dashed line). ***p < 0.001; **p < 0.01; *p < 0.05. B, CHAOS parent-reported scales that significantly differ between CI and NH participants (collapsed across age). N = 57 CI users and N = 52 NH peers. Higher raw scores indicate greater behavioral problems. ***p < 0.001; **p < 0.01. BASC indicates Behavior Assessment System for Children; CHAOS, Conduct Hyperactive Attention Problem Oppositional Symptom; CI, cochlear implant; NH, normal hearing.

