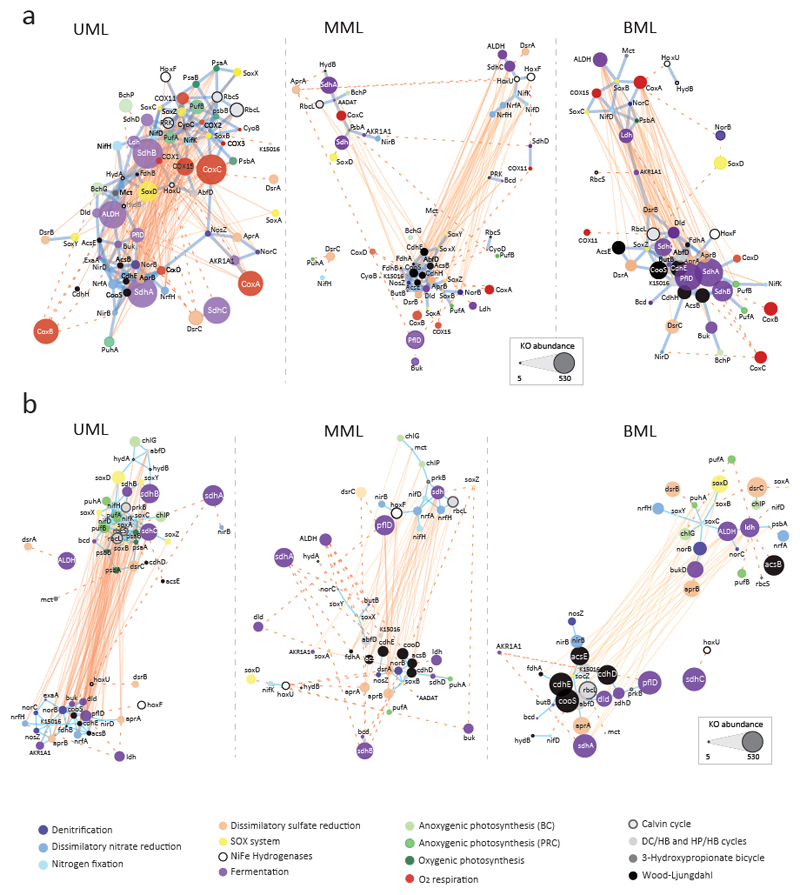
Fig. 3.
Co-occurrence networks of diagnostic KOs involved in major energy and carbon fixation metabolic pathways in Llamara microbial mats from pond LLA9. Networks were built including (a) and excluding (b) cytochrome oxidase genes (O2/NO respiration). Upper Mat Layers (UML) networks derive from metagenomes LLA9-A1, B1 and C1. ‘Middle’ Mat Layers (MML) networks derive from metagenomes LLA9-C2.I, C2.II, D1.I and D1.II. Bottom Mat Layers (BML) networks derive from metagenomes C3.I, C3.II, D2.I and D2.II. Each node represents a KO; node size is proportional to abundance. Node color alludes to the type of metabolic pathway (color code indicated). Edges depict KO co-occurrence in mat layers; reddish edges mean a negative correlation (R < -0.7) and blue edges depict positive correlations (R > 0.7). The distance between nodes is proportional to R values; edges shown in dotted lines have been shortened for visualization purposes (real size networks are shown in Supplementary Fig. 8). Network properties are detailed in Supplementary Table 8.

