1.
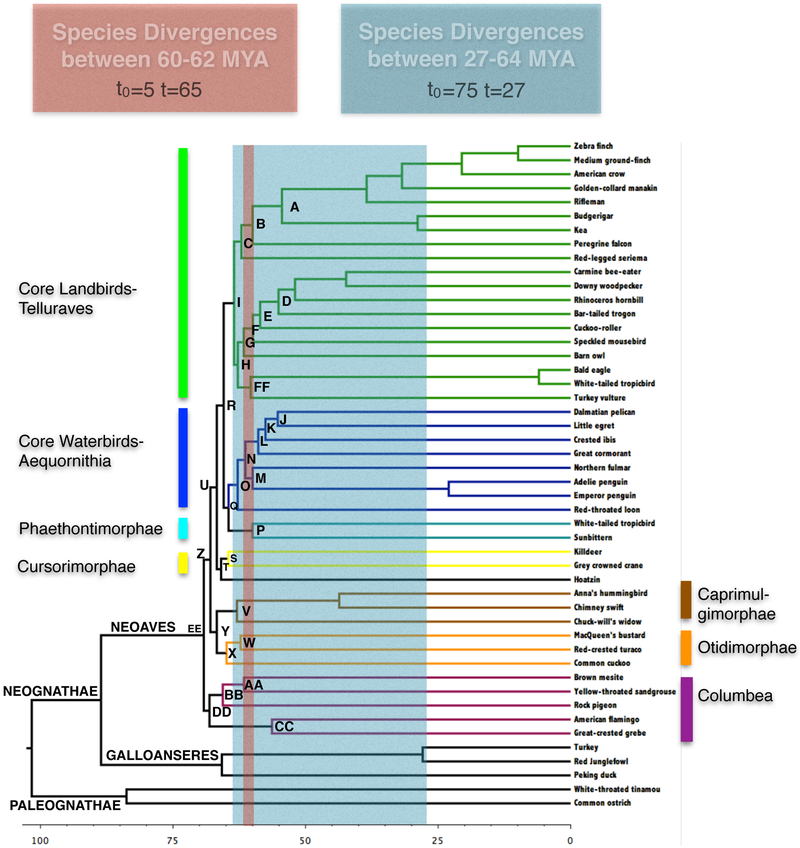
Regions of the avian phylogeny for which phylogenetic signal, noise and polytomy probabilities were calculated. The red and blue colors denote 60-62 MYA (deep) and 27-64 (shallow) MYA respectively and highlight the avian species divergences occurring these periods. The area between colored bars denotes internode length plus the average subtending branch length of each partition. The time-calibrated phylogeny is from Jarvis et al. (2014).

