3.
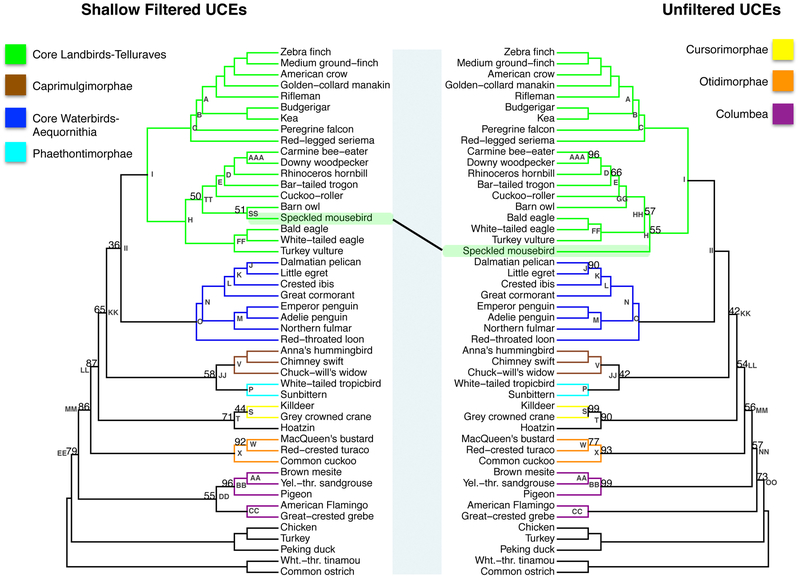
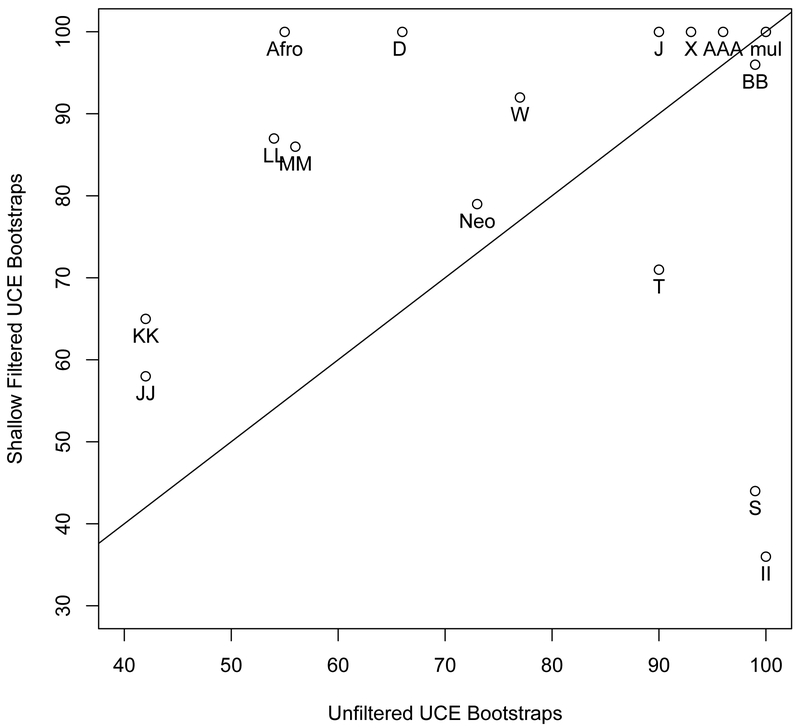
(a) The phylogenetic reconstruction based on UCE nucleotide positions which had phylogenetic signal within in the top 20th percent of the UCE′s adjusted phylogenetic signal score for species divergences between 27-64MYA (shallow filtered, left) and the phylogenetic reconstruction using all nucleotide positions (unfiltered, right). Bootstrap support values less than 100% are shown for each internal node. b. Scatter plot of percent bootstrap support (BS) when the same clade is supported in the shallow filtered UCE phylogeny and the unfiltered UCE phylogeny. The points are labeled with the same node labels as in Fig. 3(a) except for: (1) the label mul, which corresponds to the nodes A, B, C, D, E, I, K, L, M, N, O, P, V, AA, CC, FF, and JJ in Fig. 3(a); (2) the label Afro, which denotes the afroaves node H in the shallow UCE phylogeny and in the unfiltered UCE phylogeny; and (3) the label Neo, which denotes the neoaves nodes EE in the shallow UCE phylogeny and OO in the unfiltered UCE phylogeny.


