4.
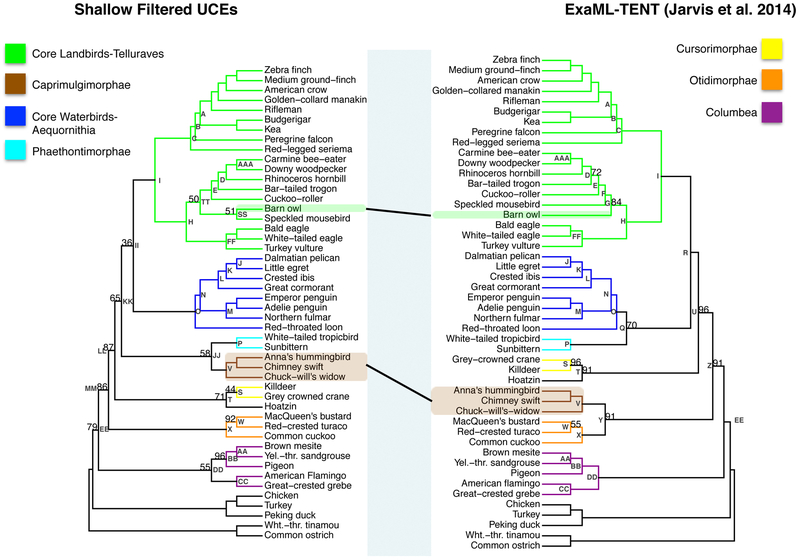
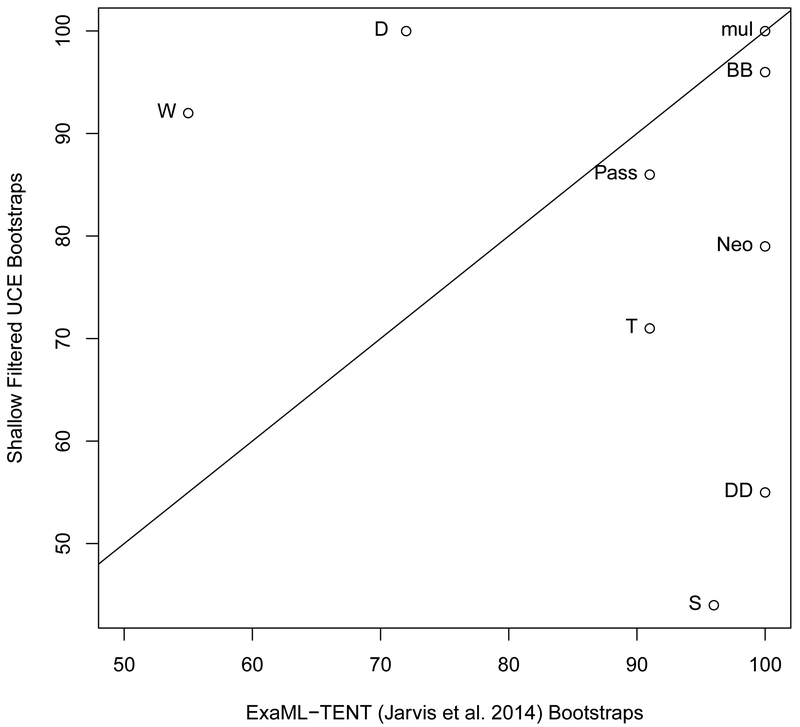
(a) The shallow filtered UCE phylogenetic reconstruction (left) and the ExaML-TENT phylogenetic reconstruction (right). Bootstrap support values less than 100% are shown for each internal node. (b) Scatter plot of percent bootstrap support (BS) when the same clade is supported in the shallow filtered UCE phylogeny and the ExaML-TENT phylogeny. The points are labeled with the same node labels as in Fig. 4(a) except for: (1) the label mul, which corresponds to the nodes A, B, C, D, E, H, J, K, L, M, N, O, P, V, AA, CC, FF and AAA in Fig. 4(a); (2) the label Neo, which denotes the neoaves node EE in the shallow filtered UCE and ExaML-TENT phylogeny; and (3) Pass, which denotes the Passerea nodes MM in the shallow filtered UCE phylogeny and Z in the ExaML-TENT phylogeny.


