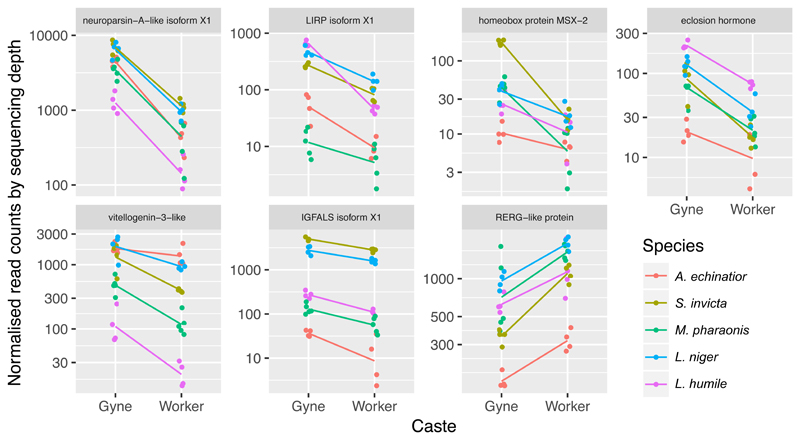
Figure 4. Expression levels for conserved caste regulatory genes expressed in the brains of gynes and workers across the five ant species with typical queen-worker differentiation.
Dots are gene expression levels for each brain sample and lines connect the average brain gene expression values for gynes and workers (both coloured according to species identity; See text for details). All expression differences between gynes and workers were significant (FDR < 0.01, two-sided Wald tests).

