
Figure 4. Conditional ablation of Exosc3 attenuates Viral Polymerase Activity.
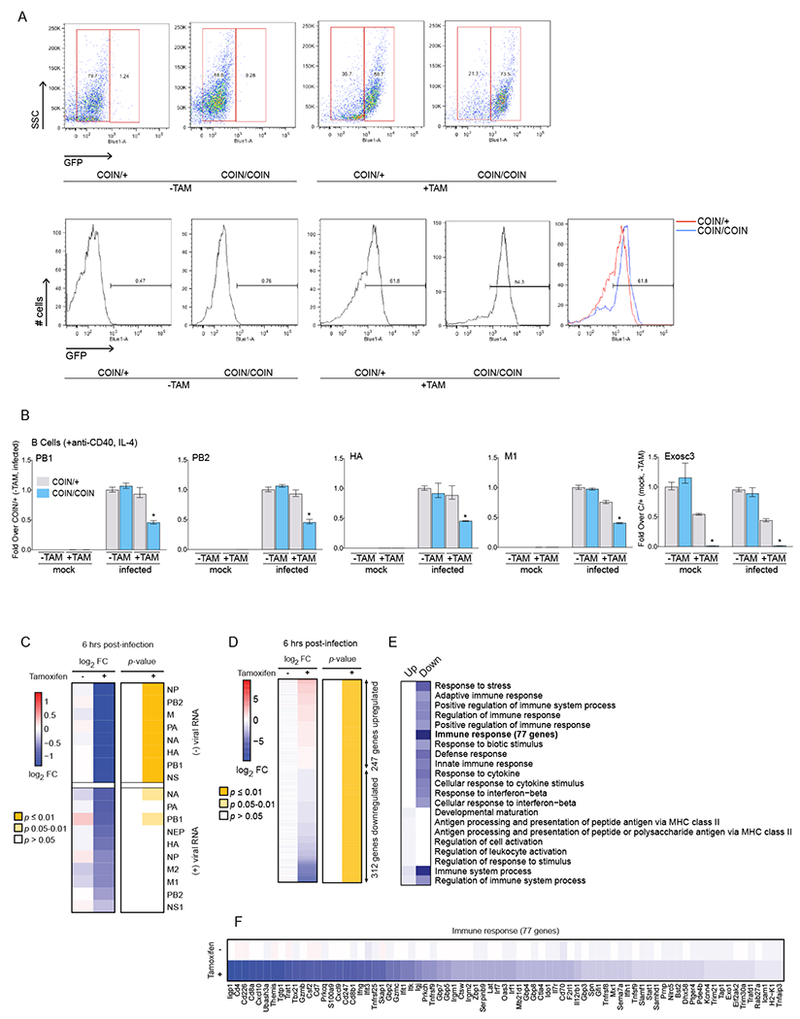
(A) Splenic B cells were isolated and expanded from two mouse types: COIN/+ (conditional heterozygous for Exosc3 depletion), and COIN/COIN (conditional homozygous for Exosc3 depletion). Cells were treated with tamoxifen (+TAM) or DMSO (−TAM) for 3 days to induce the deletion of Exosc3 and inversion of GFP. Top: Fluorescence-activated cell sorting (FACS) displaying GFP conversion with and without tamoxifen treatment at 6 hours post-infection. Bottom: FACS displaying GFP conversion against population scatter.
(B) qPCR of IAV viral mRNA levels in B cells infected with PR8 before (mock) or 6 hours post-infection (infected), along with the control of mRNA expression level for the efficiency of tamoxifen-induced depletion of Exosc3.
Statistical analyses (B) between datasets were performed with a two-tailed Student’s t-test, adjusted with a Holm-Bonferroni test for sequential comparisons. For panel B, *p<.05, **p<.005, and ***p<.0005. Error bars indicate SD from duplicate experiments.
(C) Heat map of average expression changes of positive and negative-stranded viral RNAs in murine splenic B cells in the presence or absence of tamoxifen, and at 6 hours post-infection. Expression changes (left) reflect the log2 fold-change in expression between homozygous (COIN/COIN) and heterozygous (COIN/+) Exosc3 depletion conditions. Corresponding eBayes adjusted and FDR-corrected P-values are shown on the right. Levels of positive-sense viral mRNA are overall an order of magnitude lower than negative-sense viral RNA in this directional RNA-Seq experiment (regardless of the TAM status). It is conceivable that this moderated the extent of the changes we see in vmRNA compared to vRNA levels.
(D) Heat map of average expression changes of differentially expressed cellular genes (FDR q<0.05) between COIN/+ and COIN/COIN in the presence or absence of tamoxifen, and at 6 hours post-infection.
(E) Top-enriched GO biological process categories among the differentially regulated genes from D - key to right.
(F) Heat map of average expression changes for differentially expressed genes in E annotated with the “Immune response” GO biological process term.