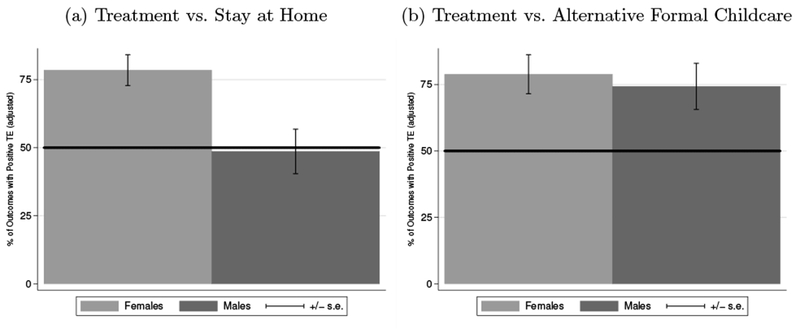
Figure 2:

Positively Impacted Outcomes, ABC/CARE Males and Females
Note: Panel (a) displays the percentage of positive treatment effects in accordance with the parameter in Equation (3)—treatment vs. staying at home—by gender. Panel (b) is analogous for Equation (4)—treatment vs. alternative formal childcare. Standard errors are based on the empirical bootstrap distribution. The null hypothesis is that the proportions of positive treatment effects are greater than 50%. For a full list of the estimated combining functions, see Appendix D.
