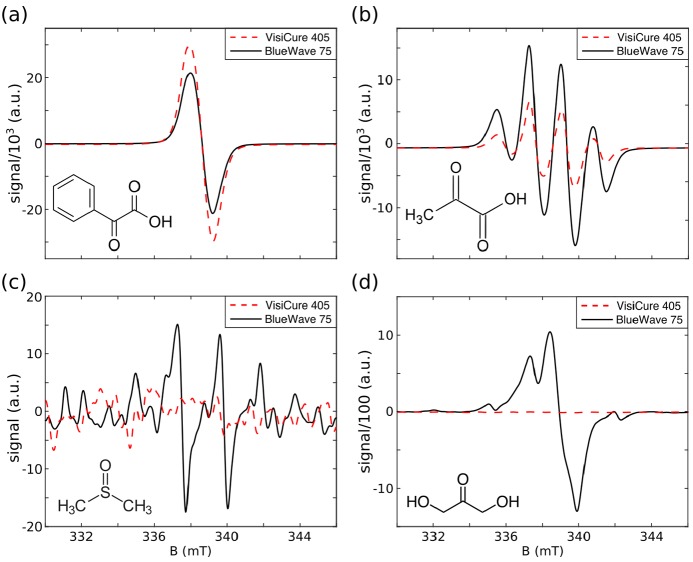
Figure 2.
X-band ESR spectra of frozen droplets in LN2, photoirradiated with a broadband (BlueWave 75) or a narrowband (VisiCure 405) light source. (a) PhGA (7.1 M) in 1:1 water/glycerol (v/v). (b) PA (7.0 M) in 1:1 water/glycerol (v/v). (c) DMSO (neat). (d) DHAc (8.0 M) in 2H2O. The spectral structures in panels b and c are caused by the hyperfine coupling to the proton spins of the methyl groups. The units on the y axis are the same in all four plots.

