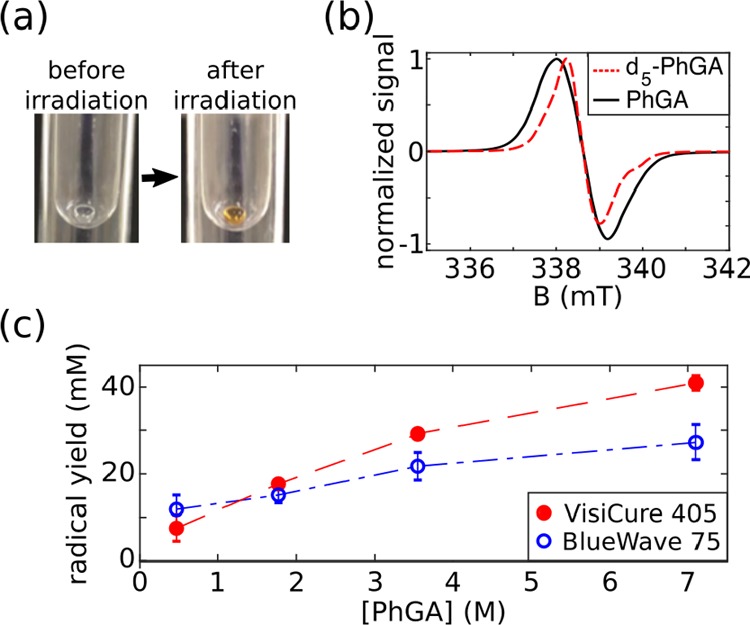
Figure 3.

Photoirradiation of PhGA dissolved in 1:1 glycerol/water (v/v). (a) A 4 μL bead of PhGA in LN2 before and after photoirradiation. (b) ESR spectrum of unlabeled PhGA and d5-PhGA. (c) Maximum radical yield vs PhGA concentration using either the broadband (blue open circle) or the narrowband light source (red dots). The radical yield is reported as the mean ± standard deviation across three measurements.
