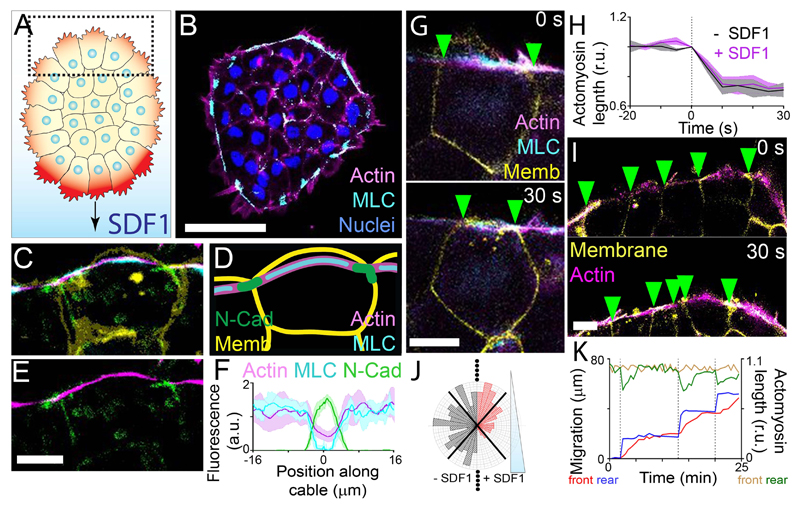
Fig. 1. Xenopus neural crest clusters exhibit a contractile actomyosin ring.
(A) Neural crest with protrusions (red) at the edge undergoes chemotaxis to SDF1. SDF1 stabilizes the protrusions at the front (darker red) (7). Dotted square: rear cells. (B) Immunofluorescence of a neural crest explant in the absence of SDF1. MLC: myosin light chain. Scale bar, 50 μm. (C to E) Immunofluorescence of a cell at the edge of a neural crest explant (C and E) and diagram (D). Memb: membrane. Scale bar, 10 μm. (F) Protein fluorescence levels (means ± SEM) along the actin cable. Position 0 μm represents the cell contact. n = 8 cells. (G) Spontaneous contraction of the actomyosin cable. Green arrowheads: cell-cell contacts. Scale bar, 10 μm. (H) Actomyosin length (means ± SEM) measured over time. Contractions start at 0 s. n = 20 cells. (I) Multicellular contraction of the actomyosin cable. Scale bar, 10 μm. (J) Distribution of actomyosin contractility at different angles without (-SDF1) or with (+SDF1) an SDF1 gradient. n = 150 contractions. (K) Relative actomyosin length at the front (brown line) and rear (green line) of a cluster, and the position of the front (red line) and rear (blue line) of the cluster.

