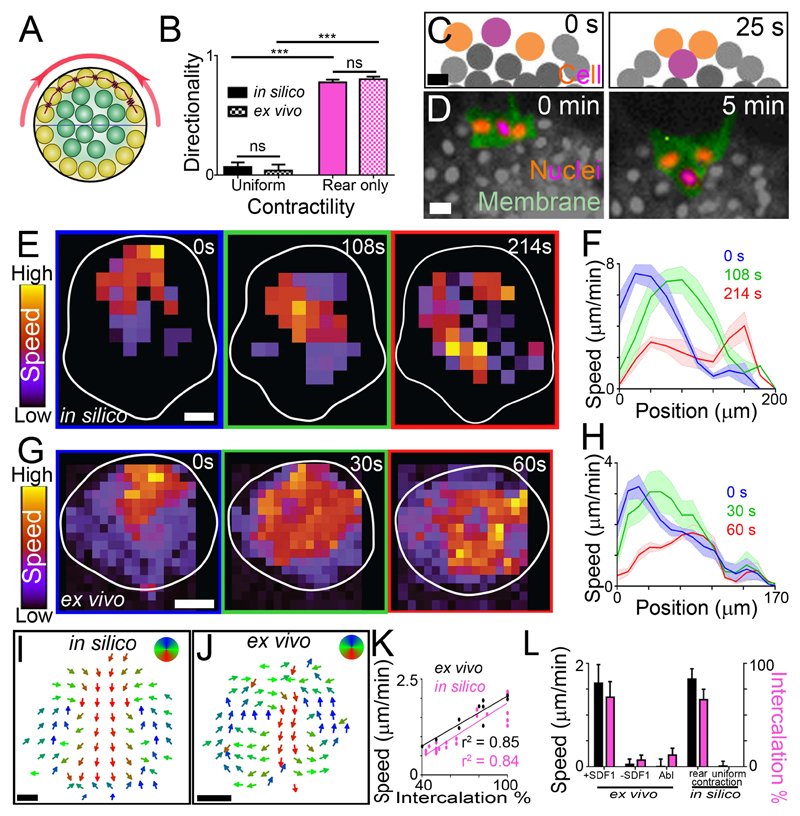
Fig. 3. Modelling contractility-driven collective migration.
(A) Illustration of the computational model cluster. Yellow: edge cells; green: internal cells; red: contraction; horizontal line: distinction between front and rear, with rear outer cells contracting (red spring). (B) Directionality (means ± SEM) of clusters. n = 10 clusters. ***P ≤ 0.001 (two-tailed Student’s t-test); ns, not significant. (C and D) Intercalation of a rear cell (purple) between two adjacent cells (orange) in silico (C) and ex vivo (D) during directional migration. Scale bar, 20 μm. (E to H) Wave of contraction. Speed heat map during migration in silico (E) and ex vivo (G). Speed profile (means ± SEM) from clusters in silico (F) and ex vivo (H) at different times during directional migration. Position 0 μm represents the rear of the cluster; position 200 μm and 170 μm (F and H, respectively) represents the front of the cluster. n = 5 clusters. Scale bar, 40 μm. (I and J) Direction of intra-cluster cell movements shown from time-averaged cell tracks in silico (I) and PIV ex vivo (J) after subtracting cluster movement. n = 5 clusters. Scale bar, 40 μm. (K) Cluster speed and rear cell intercalation during migration. (L) Cluster speed (means ± SEM) and rear cell intercalation (means ± SEM) of clusters. Abl: laser ablation of the actomyosin ring in rear cells. n = 6-21 clusters. ***P ≤ 0.001 (two-tailed Student’s t-test); ns, not significant. Top of all pictures is the rear.

