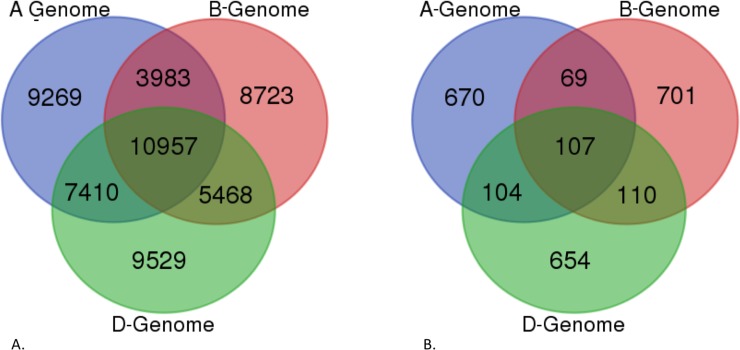
Fig 5. Venn diagram showing the distribution of protein-coding and non-ORF transcript nucleotide sequence alignment with the IWGSC cDNA sequences separated into sub-genomes.
A) Distribution of the alignment of protein-coding transcripts with the sub-genome separated cDNA sequences. B) Distribution of the alignment of non-ORF transcripts with the sub-genome separated cDNA sequences. The sub-genomes A, B, and D are represented by color, and the numbers within the circles indicate the number of transcripts aligned in each of the sub-genomes.

