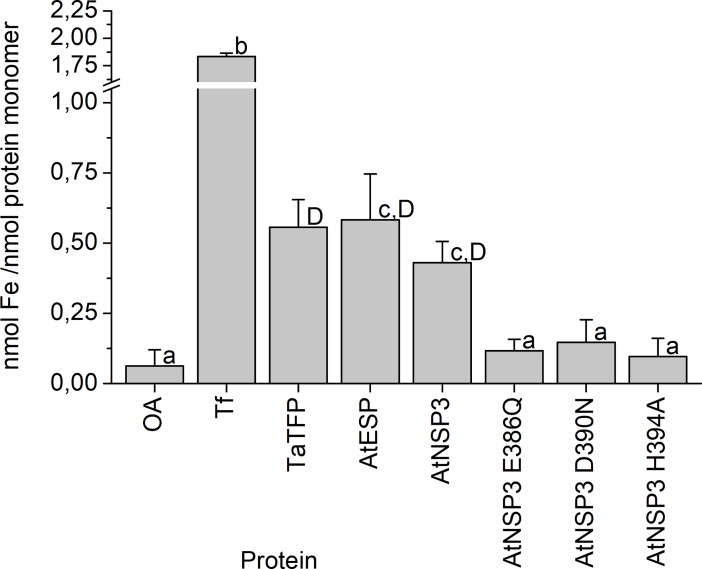
Fig 4. Ferene S quantification of iron in AtESP and AtNSP3 wildtype and mutants.
Proteins (in 50 mM MES, pH 6.5, TaTFP in 6.25% (w/v) sucrose in 37.5 mM sodium acetate buffer, pH 5) were denatured and precipitated. Fe2+ in the supernatant was quantified colorimetrically using Ferene S reagent and calibration with (NH4)2Fe(SO4)2. OA, ovalbumin; Tf, holo-transferrin. Shown are means ± SD (N = 3 independent expression experiments). Different letters above bars indicate a significant difference (p<0.05; lower case letters: ANOVA with Tukey's test (when errors were normally distributed); upper case letter: Kruskal-Wallis non-parametric test (non-normal errors)).

