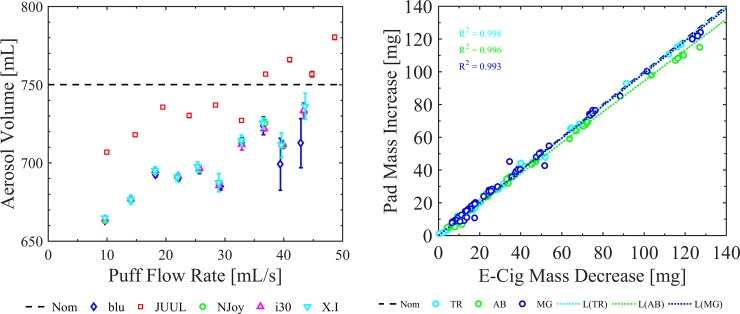
Fig 3. PES-1 System validation plots used to assess the impact of the device under test and the performance of the emission system and verify conservation of mass.
Shown are two plots used to validate the PES-1 system for mean measured cumulative volume as a function of mean measured flow rate across six repeated trials at each flow condition for the five e-cigs under test (left), and conservation of mass for various e-liquids (right). The left plot shows that the actual measured volume differed from the nominal machine volume setting for every case. Actual measured volumes and measured flow rates were used in the analysis. The right plot was generated using an NJOY Vape Pen filled with AVAIL Arctic Blast (AB), Tobacco Row (TR), and Mardi Gras (MG) e-liquids across six repeated trials and ten flow conditions. Error bars are the 95% confidence intervals on the mean. Mass conservation was assessed for each product case tested.

