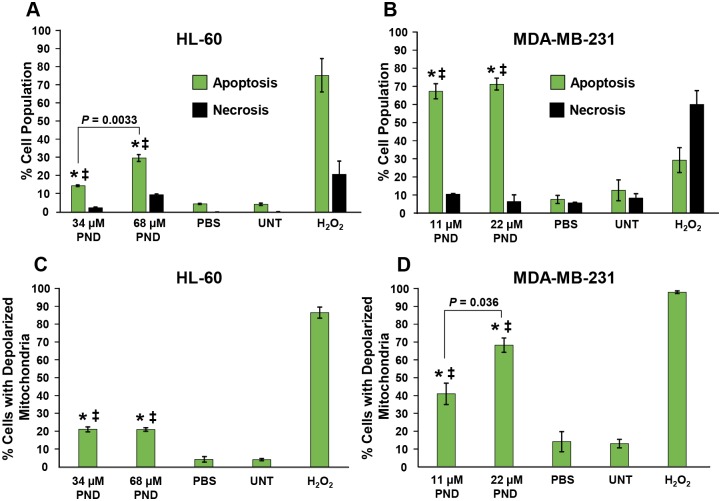
Fig 3. PND induced phosphatidylserine externalization on MDA-MB-231 (A) and HL-60 (B) cancer cells after 24 h of incubation.
The cell death mechanism was studied after double staining of cells with annexin V-FITC and PI and monitored via flow cytometry. (A-B) The total percentages of cell undergoing apoptosis (y-axis) are expressed as the sum of both early and late stages of apoptosis (green bars); whereas cells stained only with PI and annexin V-FITC negative, were counted as the necrotic cell population (black bars). Calculations of two-tailed Student’s paired t-test of PND-treated cells as compared with PBS-treated (*) and untreated (‡) cells controls, provided consistently values of P < 0.001, in both circumstances. Each bar represents the mean of triplicates, and error bars the standard deviation of the mean. PND inflicted its cytotoxic effect via mitochondrial membrane depolarization on MDA-MB-231 (C) and HL-60 (D) cells. Cells were treated with PND for 6 h and changes in the mitochondrial membrane potential (ΔΨm) were monitored by staining them with JC-1 and examined via flow cytometry. The JC-1 reagent emits a green fluorescence signal after mitochondrial depolarization. (C-D) Percentages of cells emitting a green fluorescence signal, y-axis, versus different treatments, x-axis, are depicted. 1 mM of H2O2 was used as a positive control as it strongly perturbs mitochondrial membrane potential (ΔΨm). Each bar represents the mean of three replicates and error bar the standard deviation. Two-tailed Student’s paired t-test of PND-treated cells, as compared with PBS-treated (*) and untreated (‡) cell controls, provided consistent values of P < 0.01 and P < 0.001, respectively.

