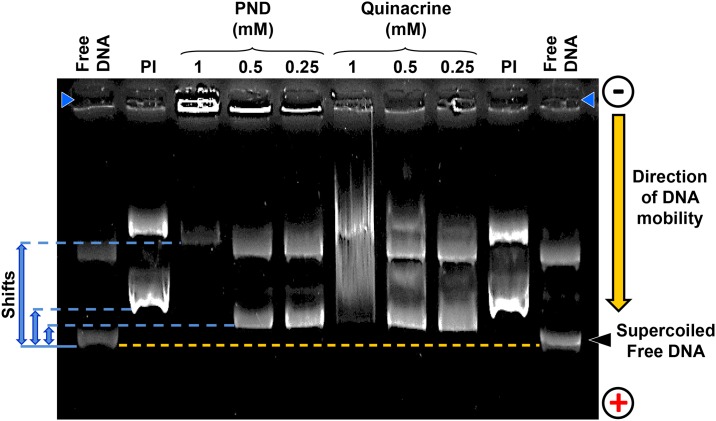
Fig 5. PND provoked DNA migration retardation in a dose-dependent manner.
Three different concentrations of PND and quinacrine were incubated individually with a 100 ng of plasmid DNA and the potential of complex formation was analyzed via agarose gel electrophoresis. Reaction products were separated by 1% agarose gel electrophoresis in Tris/acetate/EDTA buffer and stained with Ethidium bromide. Both PI and free plasmid DNA were used as positive and negative controls of DNA mobility, respectively. The loading wells are located on the top of the image indicated by two blue head arrows (top left and right corners). The yellow dashed line is indicating the maximum mobility of the free supercoiled DNA is included as a reference. Three DNA mobility-shifts are indicated by blue lines and arrows (left side of the image). The migration direction of DNA is indicated by an arrow (right side of the image); from the cathode (negative) to the anode (positive). A representative image used to review the potential formation of DNA complexes is depicted.

