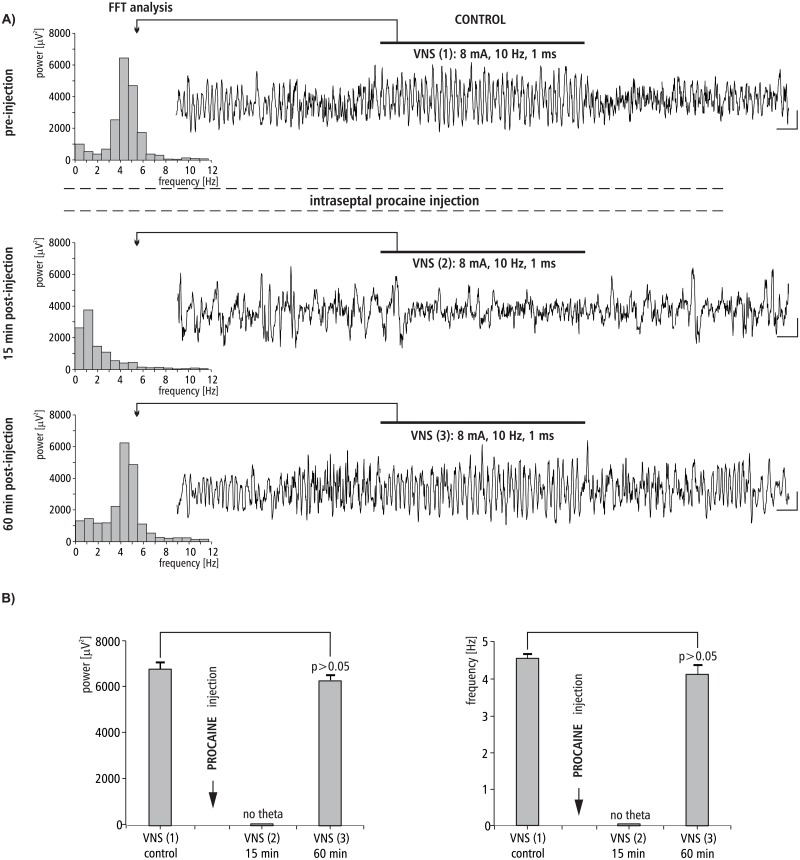
Fig 5. The effect of MS procaine injection on VNS-induced HPC field potential and related power-frequency (FFT) histogram.
(A) VNS is marked with a horizontal line. The parameters of VNS are marked below this line. Arrows indicate the power-frequency histograms calculated from the analog examples of hippocampal field potentials taken pre-injection of procaine (control), 15 and 60 min post-injection of procaine during 10 s VNS. Calibration: 1s, 150 μV. (B) Statistical analysis (Mann-Whitney U test) of mean ± SEM power and frequency (VNS (1) vs VNS(3)).

