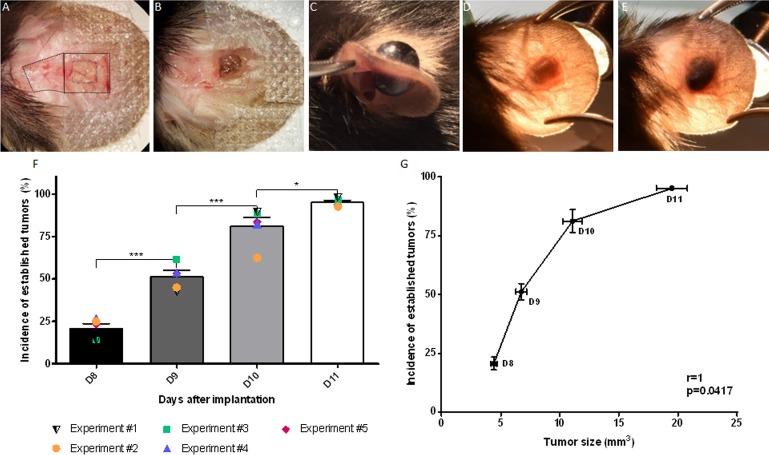
Fig 1. Tumor inoculation method.
(A-B) Ventral view of an ear during surgery (A: dotted square = area from ventral skin flap reflected; small square = outline of the region of full thickness cartilage to be removed (4 mm2). Clot containing tumor cells (B: brown nodule) placed on the region from which cartilage removed. (C) A large black tumor growing on both sides of the ear (day 13). (D) Dorsal view of an ear showing a non-established tumor (greyish) (day 8). (E) Dorsal view of an ear established black tumor (day 11). (F) Time related changes in the mean percentage of “established tumors” as evaluated by color. The mean percentage of black tumors detected between day 8 and 11 based on the 5 different studies are represented by the error bars. Results for each individual study are represented by colored symbols. (G) Correlation plot between the percentage incidence of black tumors and their size as a function of time after trans-plantation. r: correlation coefficient. Data shown as mean ± SEM. *: p<0.05, ***: p<0.001, ****: p<0.0001.

