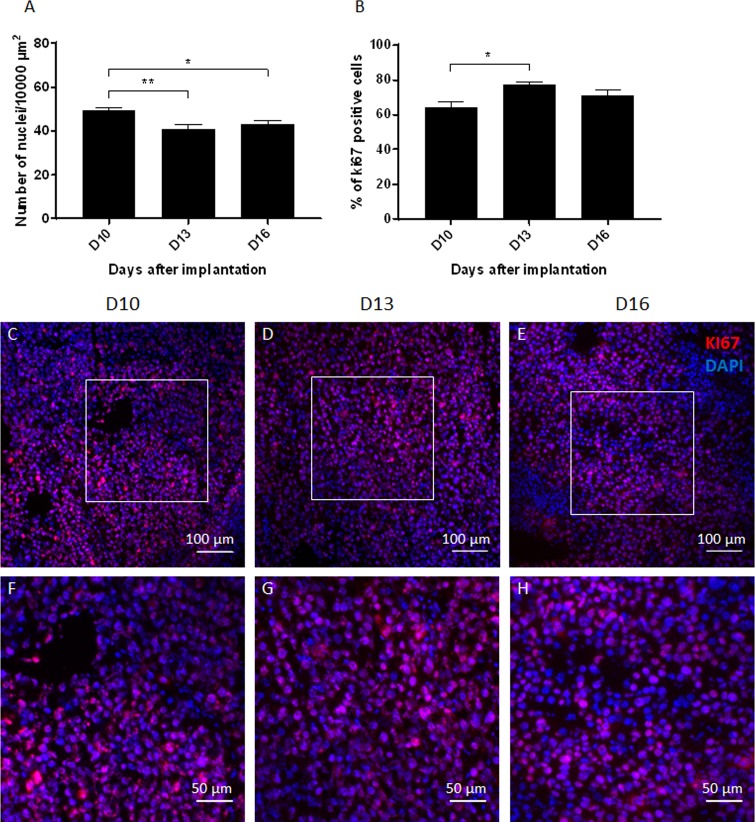
Fig 5. Quantification of tumor cell characteristics.
(A) Time related changes in the cell density obtained by the number of nuclei in an area of 10000 μm2 of hematoxylin-eosin stained sections. (B) Time related changes in the percentage of KI67 positive cells among 100 Dapi-positive nuclei. (C, D, E) Representative merged images of KI67 and DAPI staining in frozen sections showing proliferating cells (Ki 67, red) among side blue Dapi-positive nuclei on D10 (C), D13 (D) and D16 (E) after implantation. (F, G, H) Zoom in of the white square in pictures A (F), B (G) and C (H) represented the cell density at higher magnification. Data shown as mean ± SEM. *: p<0.05, **: p<0.01. Scale bars: 100 μm (C, D, E) and 50 μm (F, G, H).

