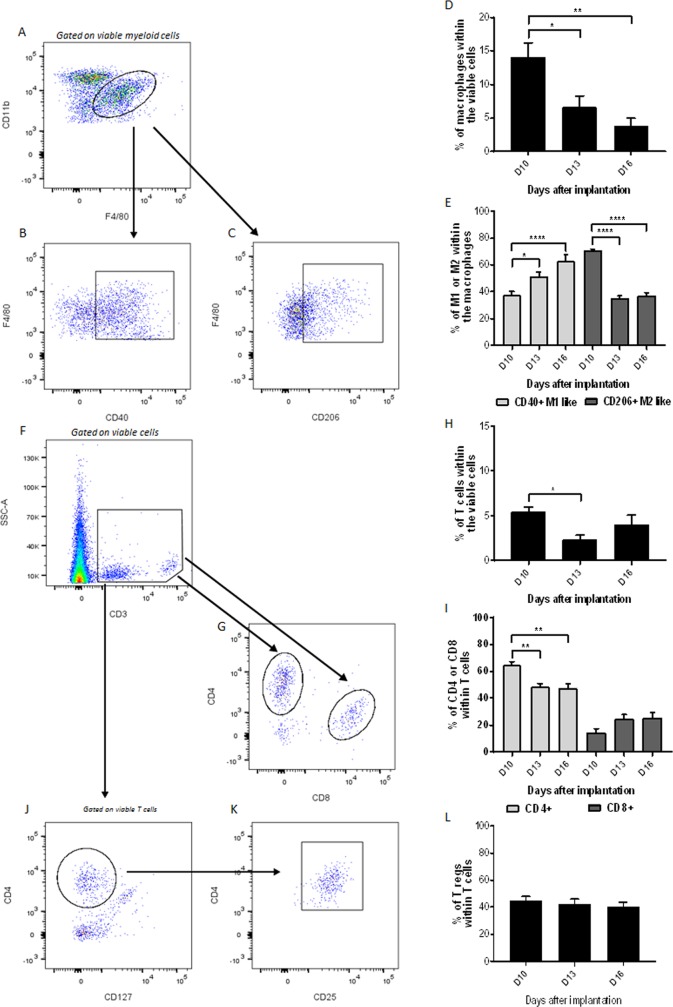
Fig 6. Characterization of macrophages and T cells.
(A, B, C) Representative plots for the identification of the macrophage population (A) and of their two subtypes, M1-like (B) and M2-like (C) macrophages versus days after implantation. (D, E) Percentage of macrophages (D) and macrophage subtypes (E) versus days after implantation. (F, G) T cells (CD3) identification strategy (F) for the CD4+ and CD8+ subpopulations (G). (H, I) Percentage of T cells among viable cells (H) and T cells subpopulations (I) among all T cells, both versus days after implantation. (J, K, L) Representative plots for identifying T regulatory cells (CD4+CD127-, J, CD25+, K) among T cells, versus days after implantation. (L). Data shown as mean ± SEM. *: p<0.05, **: p<0.01, ***: p<0.001, ****: p<0.0001.

