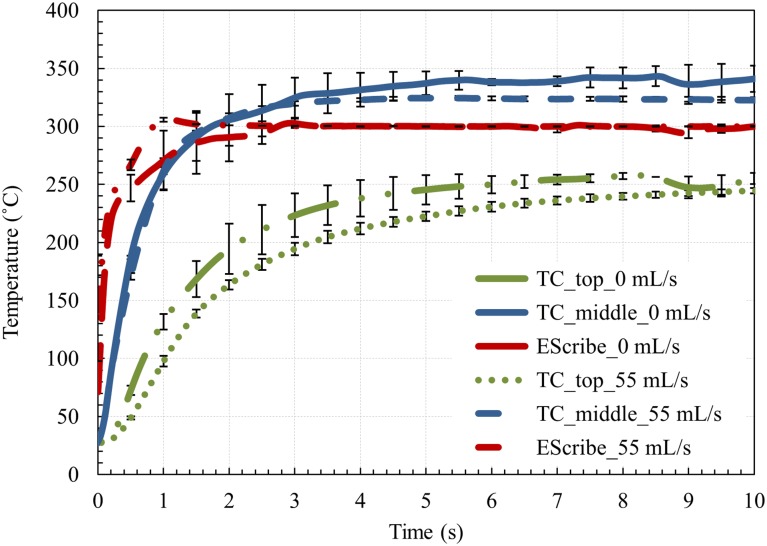
Fig 3. Coil temperature recorded by TCs and EScribe for two flow rates of 0 mL/s and 55 mL/s.
Long dash dot dot green line: temperature measured at the top section of the coil for the air flow rate of 0 mL/s, solid blue line: temperature measured in the middle section of the coil for the air flow rate of 0 mL/s, long dash red line: temperature measured by EScribe for the air flow rate of 0 mL/s, dot green line: temperature measured at the top section of the coil for the air flow rate of 55 mL/s, dash blue line: temperature measured in the middle section of the coil for the air flow rate of 55 mL/s, dash dot red line: temperature measured by EScribe for the air flow rate of 55 mL/s.

