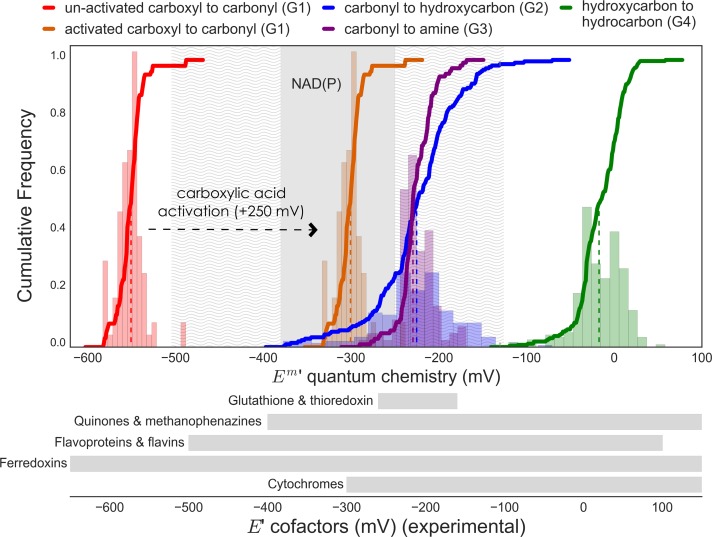
Fig 3. Distributions of predicted standard transformed redox potentials at pH = 7 and I = 0.25 for a dataset of 650 natural and non-natural reactions.
The average reduction potentials for each reaction category are (values rounded to nearest multiple of 5): un-activated carboxylic acid to carbonyl (G1: <E′m> = −550 mV), activated carboxylic acid to carbonyl (activated G1: <E′m> = −300 mV), carbonyl to hydroxycarbon (G2: <E′m> = −225 mV), carbonyl to amine (G3: <E′m> = −225 mV), and hydroxycarbon to hydrocarbon (G4: <E′m> = −15 mV) Both histograms and cumulative distributions (bold lines, right y-axis) are shown. The distributions for unactivated and activated carboxylic acid to carbonyl reductions (red and purple) are the same, but shifted by +250 mV. Dashed colored lines show the median redox potential for each reaction category. Grey shaded regions corresponds to the range of NAD(P) redox potential, while light grey wavy lines delimit the region of reversible oxidation/reduction by NAD(P)/NAD(P)H. Ranges of reduction potentials for different alternative cofactors are shown as grey rectangles underneath graph (S1 Table).

