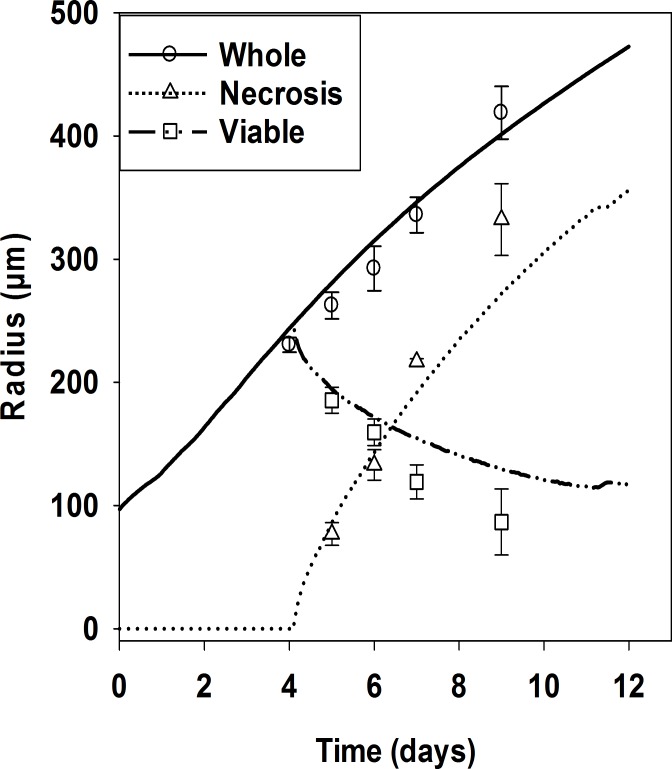
Fig 4. Quantitation of histological characteristics of spheroids and comparison with outputs of the SABM.
The overall diameter (circles), diameter of the necrotic region (triangle), and thickness of viable rim (plotted here as twice the viable rim thickness, rectangles) of HCT116 spheroids were quantitated using H&E stained histological sections illustrated in Fig 3. Values are means ± SD (n = 4 spheroids, 5 on day 7). The lines are the corresponding outputs of SABM simulations using oxygen and glucose parameters fitted to monolayer and MCL experimental data (See Table 1).

