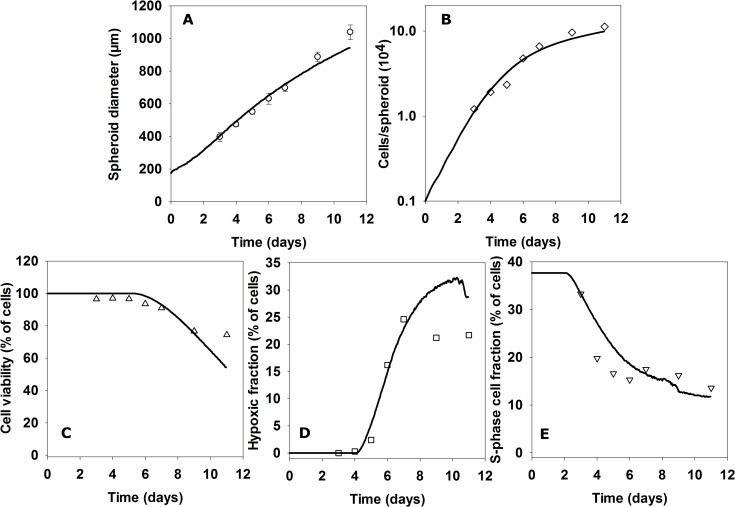
Fig 5. Comparison of growth and cellular characteristics of HCT116 spheroids with outputs of the SABM.
On the indicated days, diameters of spheroids (A) were measured. Values are means ± SD (n ≥48 spheroids). After exposing spheroids to EdU or EF5, spheroids (n = 48 spheroids) were pooled and dissociated and the number of cells in cell suspension were counted to estimate total cell number per spheroid (B), followed by exposing cells in 1 μg/mL PI for 2 min to measure cell viability by flow cytometry (% PI negative, C). Hypoxic fraction (% EF5-positive cells, D) and S-phase fraction (% EdU-positive cells, E) were measured by flow cytometry. The predictions of the SABM (lines), using fitted parameters from monolayer and MCL experiments, plotted with experimental data (points) are: (A) spheroid diameter (A) total cell number, (B), fractions of cells not tagged for death (C), fraction of cells below 0.5μM O2 (D) and estimated S-phase fraction based on the assumption that 37% of cells were initially in S-phase.

