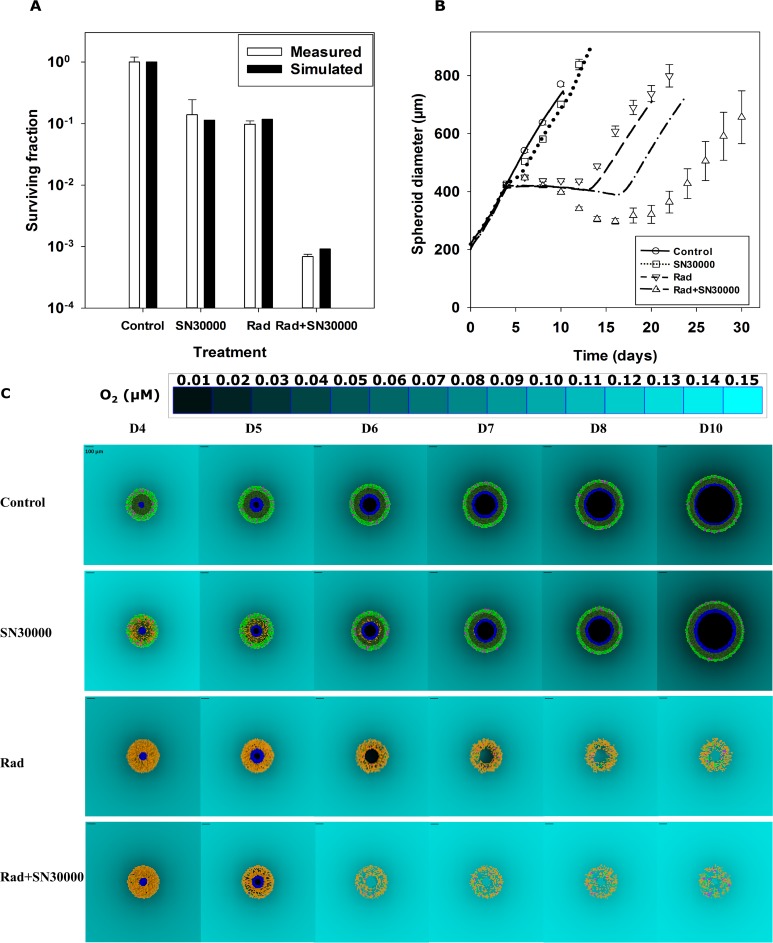
Fig 8. Comparison of simulated and measured spheroid responses to SN30000 and radiation in combination.
The predicted and measured clonogenic cell killing (A) and growth (B) of spheroids seeded with 1000 cells and treated on day 4 under 5% ambient O2 with 25 μM SN30000 for 2 hr alone, 12 Gy radiation alone or both (25 μM SN30000 for 2 hr, followed by 12 Gy radiation 1 hr after SN30000 removal). Values are means ± SEM (n = 8 spheroids for A and n = 16 spheroids for B). SABM predictions are based on the optimized parameters in Table 1. 2D snapshots from the SABM (C) illustrate cell fate and spheroid regrowth after the treatments, with the D4 output immediately following irradiation. Yellow cells are tagged for treatment-induced death, pink cells represent dividing (mitotic) cells, light green cells were highly proliferative well-oxygenated cells, dark green cells were low proliferative hypoxic cells, blue cells are cells tagged for hypoxia-induced cell death, and central dark region represents necrosis. Cell motility and fluid flow, to simulated spheroid shrinkage, is not implement yet (see text). The scale bar = 100 μm and a color-coded legend for oxygen concentration in medium is shown.

