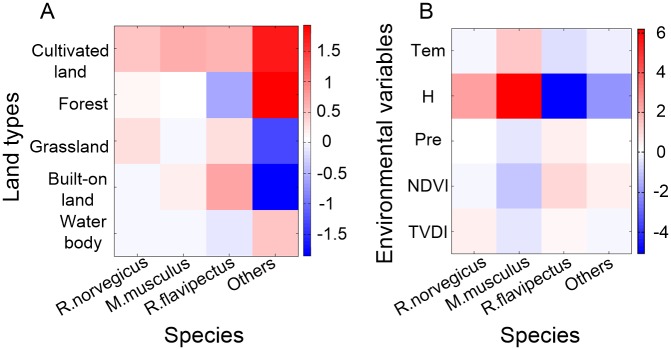
Fig 6. (A) Potential contact rates, as determined by potential contact matrix β, between humans and rodents among the different land-use types in Chenzhou; (B) Environment-to-rodent influence rates on different rodent species in Chenzhou for the different environmental variables, as determined by the environmental coefficient matrix α.
Low values are shown in dark blue and high values in red. Positive values represent positive associations, and vice versa. Tem: temperature, H: relative humidity, Pre: precipitation, NDVI: the normalized difference vegetation index, TVDI: the temperature vegetation dryness index.

