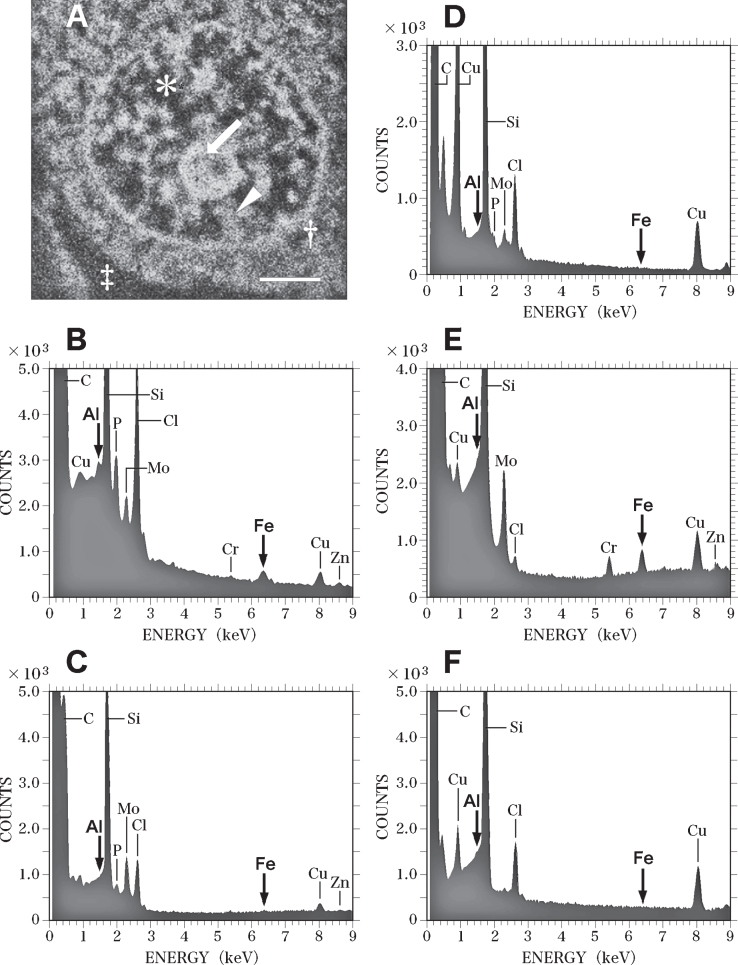
Fig. 8.
SEM-EDS analysis of the nucleus of the nerve cell in the control brain exhibited in Fig. 7. A) SEM image of the nucleus of the nerve cell in the control brain shown in Fig. 7. SEM image shows the nucleolus (arrow), heterochromatin (arrowhead) and euchromatin (asterisk) in the nucleus. Dagger shows the perinuclear cytoplasm. Double dagger indicates the extracellular space. Scale bar, 1μm. B) EDS spectrum of the nucleolus (A, arrow) of the nerve cell in the control brain. Arrows indicate the sites for Al Kα (1.487 keV) and Fe Kα (6.404 keV), respectively. Al and Fe peaks (arrows) are detected in the nucleolus. However, these Al and Fe peaks of the nucleolus in the control brain are significantly lower than those measured in the AD brain C) EDS spectrum of the heterochromatin (A, arrowhead) in the nerve cell of the control brain. No Al or Fe can be detected in the heterochromatin in the control brain. D) EDS spectrum of the euchromatin (A, asterisk) in the nerve cell in the control brain. No Al or Fe can be detected in the euchromatin in the control brain. E) EDS spectrum in the perinuclear cytoplasm (A, dagger) in the nerve cell in the control brain. The elevated peak for Fe is demonstrated in the perinuclear cytoplasm. In contrast, no Al peak is detected. F) EDS spectrum in the extracellular space (A, double dagger) in the control brain. No Al or Fe can be detected in the extracellular space in the control brain.

