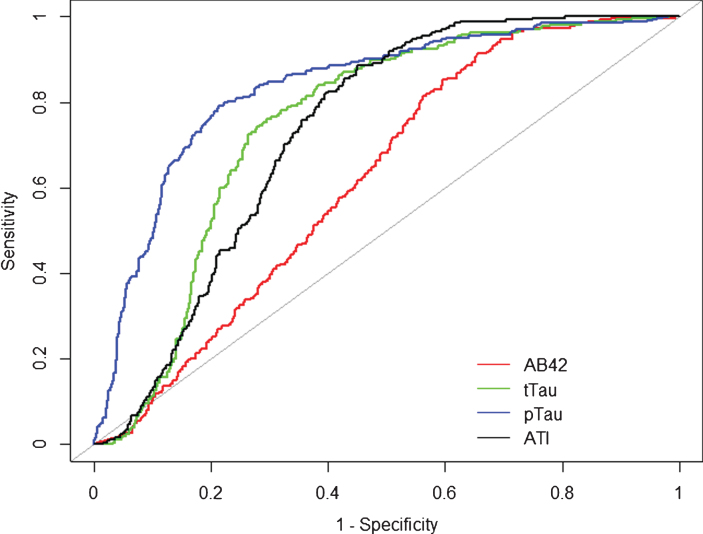
Fig.1.
Receiver operation curve (ROC). Alzheimer’s disease compared to overall population of the cohort. Alzheimer’s disease (n = 264) was compared to the overall population of the cohort (n = 752). Aβ42 (red), tTau (green), pTau (blue), and ATI (black) CSF biomarker ROC curves are reported here. AUC analyses fully reported in the text.

