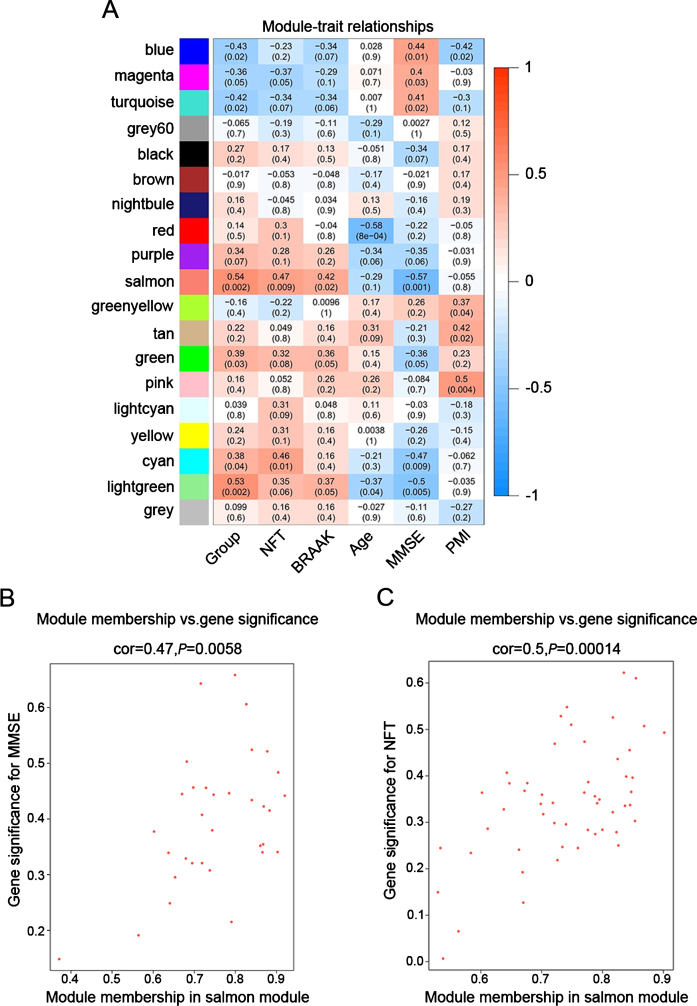
Fig.3.
Target modules screening and analysis. A) Pearson correlation coefficient between the module eigengene and sample feature vector, numbers in brackets indicate the corresponding p values. B, C) Correlation between module membership (MM) and gene significance (GS) for MMSE (B) and NFT (C) of all genes in salmon module. Cor represents absolute correlation coefficient between GS and MM.

