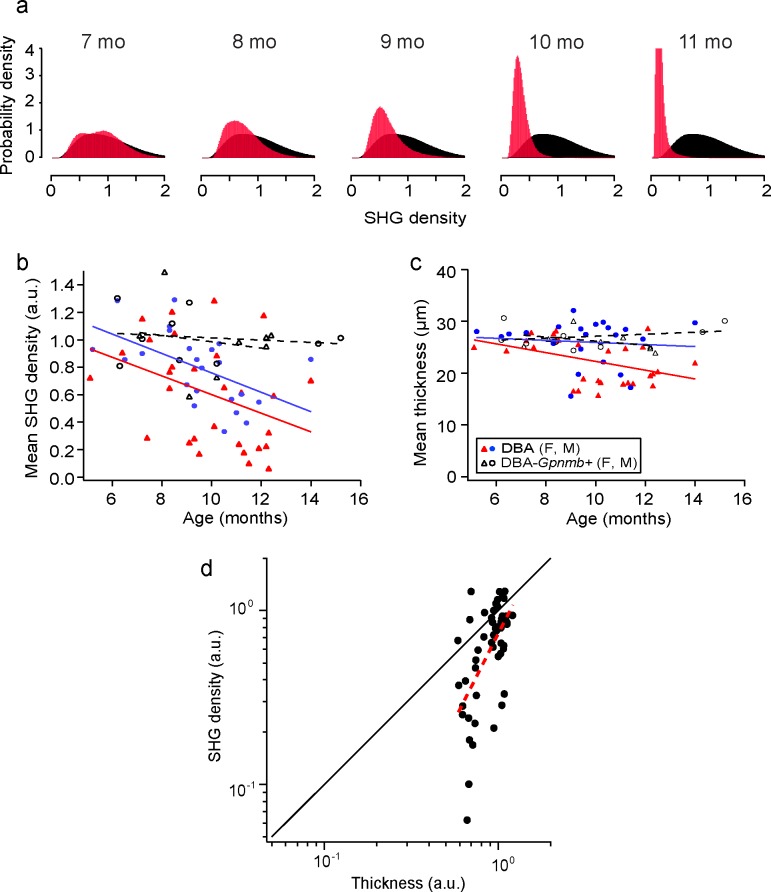
Figure 3.
MT deficiency is specific to the DBA/2J strain and depends on age and sex. (a) The probability density functions of SHG density for DBA/2J mice at ages from 7 to 11 months (red), overlaid with the average of DBA/2J-Gpnmb+ mice between 6 and 13 months of age (n = 17, black). (b, c) The mean thickness and SHG density for DBA/2J (red and blue) and DBA/2J-Gpnmb+ mice (black) as a function of age. Two symbols (triangle and circle) denote sexes and the dashed lines show the linear regression. (d) The relative magnitudes of SHG density versus thickness of the DBA retinas across ages. The mean SHG density and the normalized mean thickness are shown on the logarithmic scales with the best fit to the model (red dashed line,  ).
).

