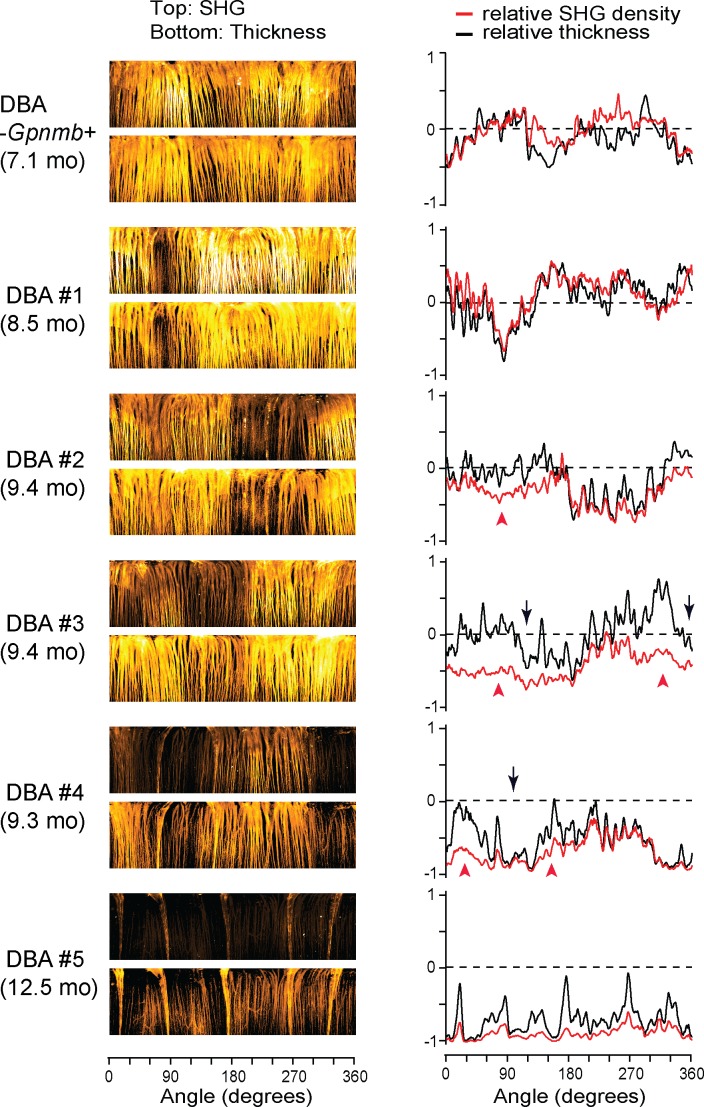
Figure 4.
MT disruption and loss of RGC axons are spatially correlated. Five representative DBA/2J retinas with sectorial degeneration are depicted (#2 is the same retina as in Fig. 1e), along with one DBA/2J-Gpnmb+. Left: The integrated SHG intensity and the thickness in the polar coordinates. Right: The relative SHG density and the relative thickness as a function of angle. The zero lines (dashed) indicate the average of DBA/2J-Gpnmb+ (n = 17). The regions with significant spreads between SHG density and thickness (red arrowheads) are found near axonal degeneration (black arrows).

