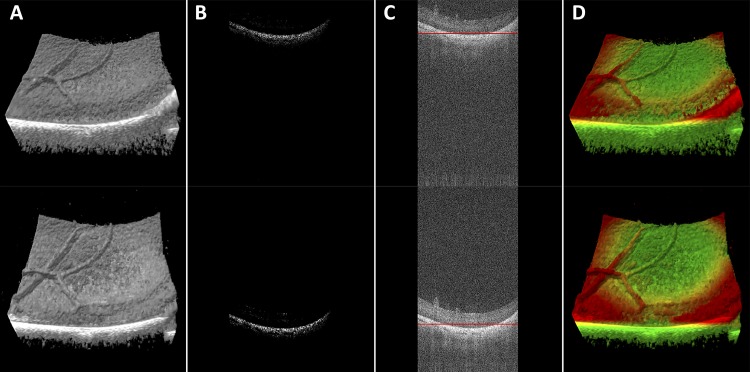
Figure 1.
MIOCT volumes and B-scans demonstrate the colorization and stabilization processes. A non-colorized MIOCT volume (A) is filtered with a threshold at the 99th percentile of reflectivity values (B), center of mass is calculated (C, red line) and color is applied (D). Top and bottom sequences demonstrate stability with axial motion.

