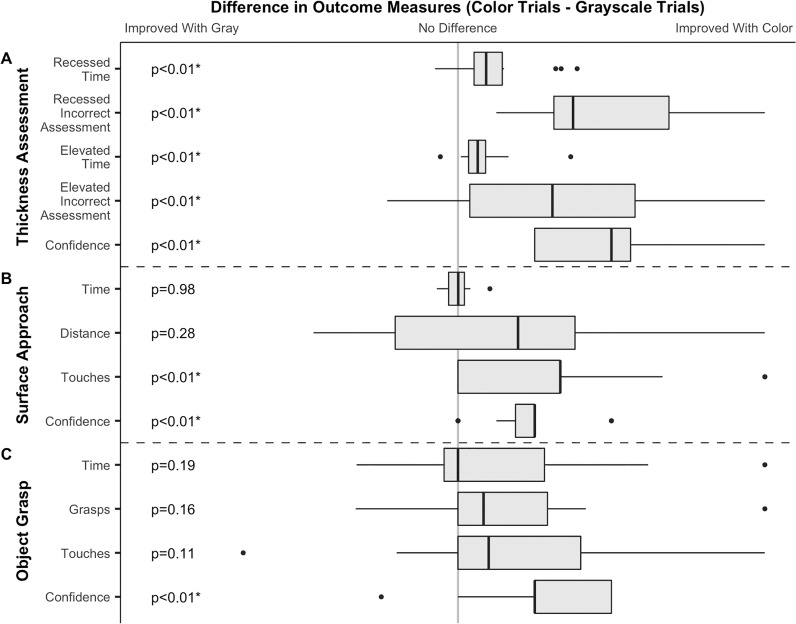
Figure 4.
Box and whisker plots summarizing measured outcomes of the thickness assessment (A), surface approach (B) and object grasp (C) skills. Data are presented as paired differences between colorized and grayscale trials. Data for each outcome was normalized from −1 to 1 based on the largest absolute value for that outcome. As such, time and confidence measures are plotted on consistent axes between skills while other measures are on unique axes. Axes are oriented such that values to the right of center support colorization, while values to the left of center support grayscale for all outcomes. The grey line delineates the point of no difference between colorized and grayscale visualization. Dashed lines delineate measures for each of the three tested skills. P values for each paired comparison are listed on the left and marked (*) when meeting the specified significance value of 0.05.

