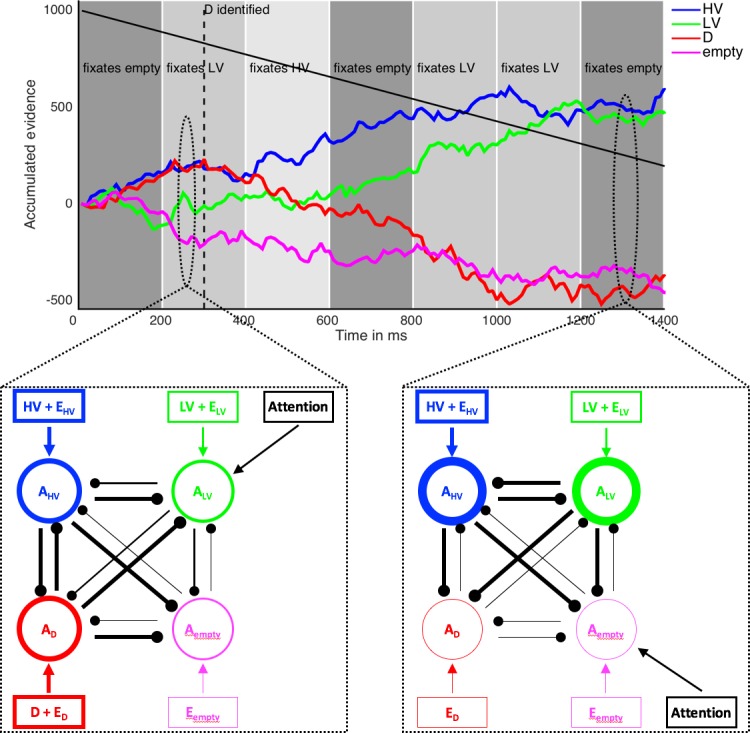
Figure 6. Illustration of the computational model MIVAC.
Depicted is the development of accumulators of the MIVAC model with estimated parameters from a representative example participant in an example trial (upper panel) together with schematic outlines of the model at two different time points (lower panels). MIVAC consists of four accumulators representing HV, LV, D, and the empty quadrant. At every time step, each accumulator Ax (round nodes in lower panels) receives an input (rectangular nodes) that is equal to the expected value of x (set to 7.5, 5, 10.5, and 0 in this example), plus Gaussian noise Ex. Accumulators inhibit each other (connecting lines between round nodes). Thicker round nodes, rectangular nodes/arrows, and lines indicate higher accumulation states, input, and inhibition, respectively. A choice is made as soon as an accumulator reaches an upper boundary that decreases with time (decreasing black line in upper panel). In this example, HV is chosen after ~900 ms. After D is identified (at 300 ms in this example; dashed vertical line in upper panel), the value of D does not serve as an input to its accumulator anymore. Every 200 ms, a new fixation is made (background greyscale), and the accumulator of the currently fixated option receives an additional input (black ‘Attention’ rectangular nodes). According to the value-based attentional capture element of MIVAC, the probability of fixating an option depends on its (relative) value.


