. 2018 Nov 5;7:e39659. doi: 10.7554/eLife.39659

Figure 7. Quantitative and qualitative tests of MIVAC.

(A) Left panel: average model fits for MIVAC and its simplifications for trials with D present (BIC = Bayesian Information Criterion; lower BICs indicate better fits). MIVAC had the lowest BIC (p < .001 for all pairwise comparisons). Right panel: model evidence per participant. (B) The same as in (A) but generalized to trials with D absent. MIVAC had the lowest deviance (< .001 for all pairwise comparisons). (C) Upper panel: choice proportions (black line) for the five potential actions together with predictions of MIVAC (continuous grey line) and one of its variants (dashed grey lines). Middle panel: the same but for trials with D absent. Lower panel: observed and predicted probabilities of choosing D as a function of D’s value. It can be seen that the variants of MIVAC without value-based attentional capture or attention-based enhancement of value accumulation fail to predict that choices of D increase as D’s value increases. In contrast, the other two variants (i.e., without detection of D, baseline MI) predict too many choices of D. (D) Predicted RT effects of the value of D by MIVAC; the model correctly predicts all RT effects observed in the data (see Figure 5C). (E) Generalization of MIVAC to the novel trials; the model reproduces the observed qualitative patterns of both relative and absolute choice accuracy (see Figure 5D).

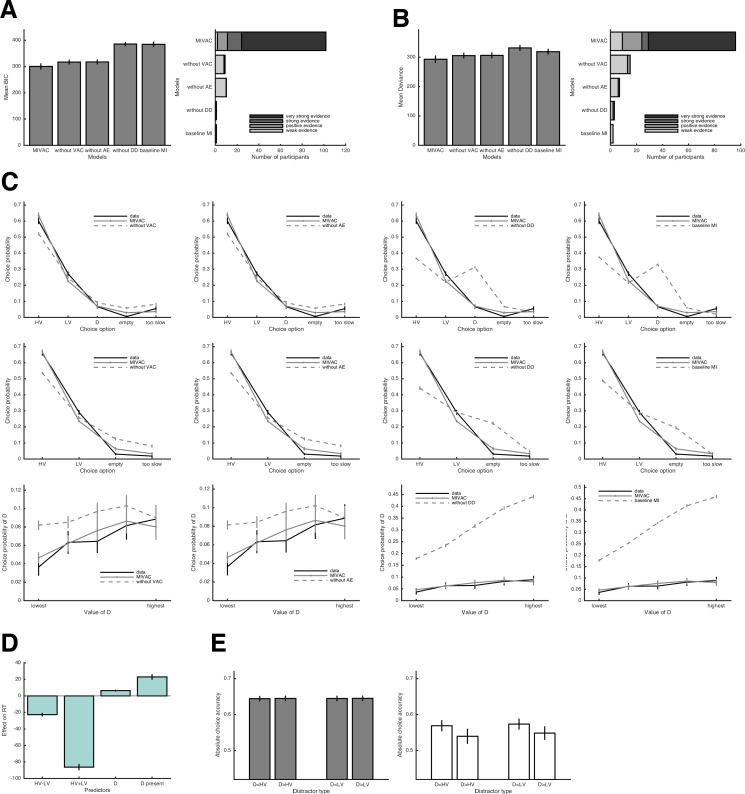
Figure 7.

Figure 7—figure supplement 1. Model recovery results.

Figure 7—figure supplement 1.

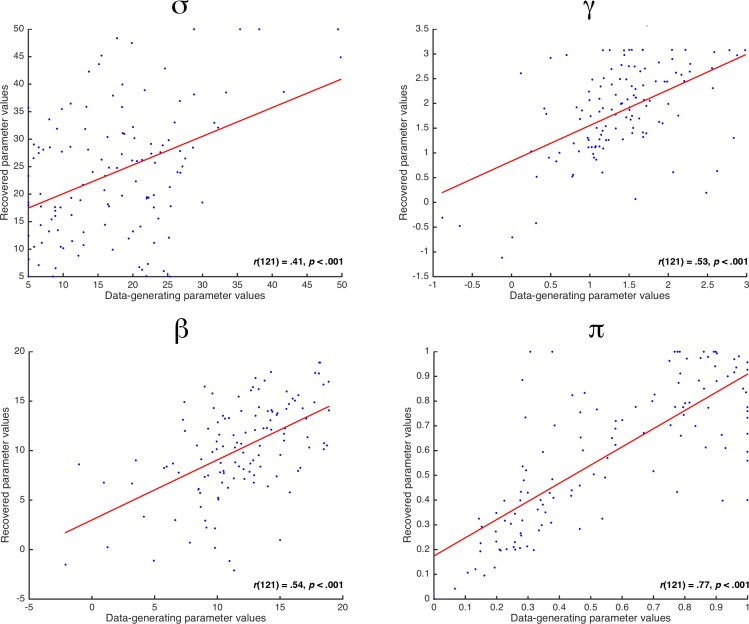
Correlations between the data-generating and recovered parameter values for MIVAC’s four parameters. To create realistic testing conditions, the model recovery analysis used the estimated parameters of each participant and generated synthetic data for the 150 trials that were used to fit the model. σ=standard deviation of accumulation, γ = value based attentional capture, β = attention based enhancement of accumulation, π = probability to identify D as being unavailable.
Figure 7—figure supplement 2. MIVAC with EU-based subjective values as inputs.

Figure 7—figure supplement 2.

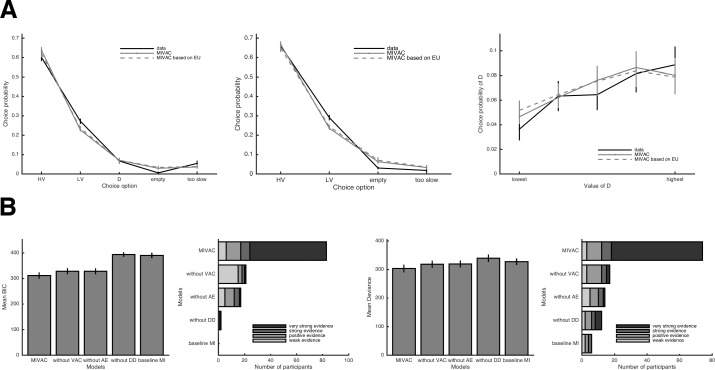
(A) Comparison of qualitative predictions of MIVAC with EV or EU-based subjective values as input to the options’ accumulators. The two variants make very similar predictions. (B) Quantitative model comparison between all MIVAC variants with EU-based subjective values. The full model still provides the best account of choices with D present (left panels) and choices with D absent (right panels). Details on the implementation of EU-based subjective values within MIVAC are provided in the Methods.
Figure 7—figure supplement 3. Fixation durations and MIVAC with empirical fixation durations.

Figure 7—figure supplement 3.

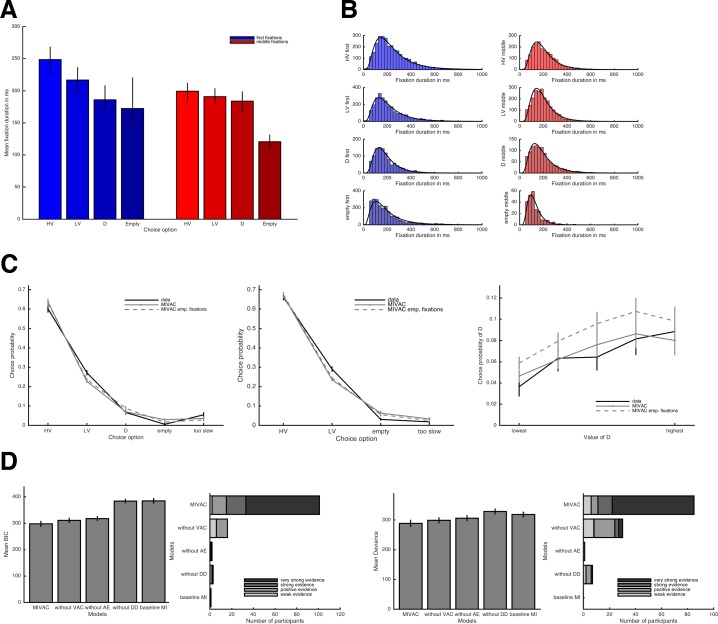
(A) Average fixation durations separated by choice option and first vs. middle fixations. (B) Fixation duration histograms separated by choice options and first vs. middle fixations together with fitted log-normal distributions (for the simulations of MIVAC with empirical fixations, durations are samples from these distributions). (C) Comparison of qualitative predictions of MIVAC without and with empirical fixations. The two variants make very similar predictions. (D) Quantitative model comparison between all MIVAC variants with empirical fixations. Using the empirical fixations does not help the simplified variants of MIVAC to catch up with the full model.
Figure 7—figure supplement 4. Predictions of IIA violations with extension of MIVAC.

Figure 7—figure supplement 4.

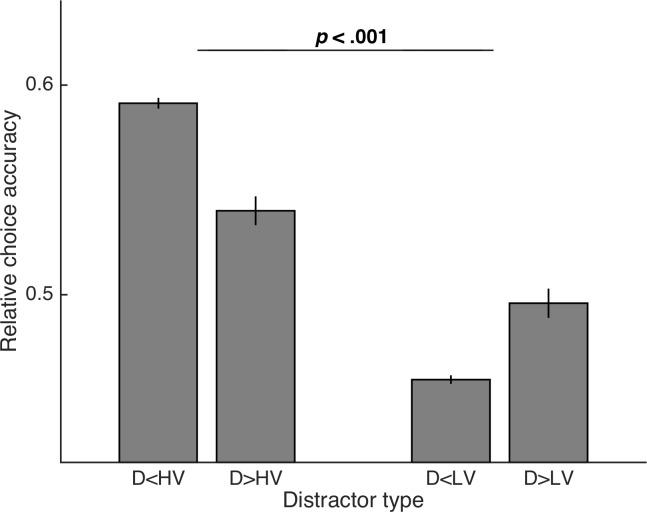
An extended version of MIVAC that includes attribute-wise comparison mechanisms borrowed from the MLBA model (Trueblood et al., 2014) predicts the IIA violation as seen in the variant of the Chau2014 task with long deliberation time (i.e., Experiment 2, Group LP), that is, a higher probability of choosing HV as compared to choosing LV when D is more similar to HV than to LV. Thus, MIVAC belongs to a class of sequential sample models that generally allows accounting for violations of IIA.
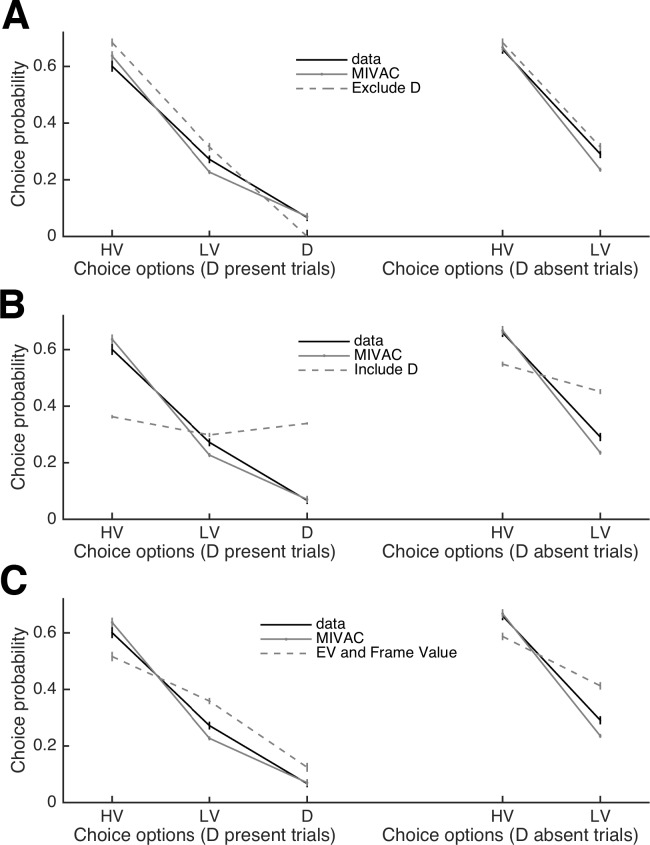
Figure 7—figure supplement 5. Comparison of MIVAC with multinomial logit (standard economic) choice models.

Figure 7—figure supplement 5.

(A) Comparison of actual choice proportions with the predictions of MIVAC and the logit model that assumes that D cannot be chosen. For obvious reasons, the logit model fails to predict that D is sometimes chosen. (B) The same as in (A) but with the logit model assuming that D is a regular choice option. This logit model predicts too many choices of D. (C) The same as in (A) but with the logit model assuming that choices are based on a combination of the options’ EV and the subjective value of the frame that indicates whether an option is a target or a distractor. This model predicts a too low relative choice accuracy. This is because the model has to assume a very high value difference between target and distractor frames to be able to predict that D is chosen in only a minority of trials (it still tends to predict too many choices of D). As a consequence, the EV difference between HV and LV is marginalized, because both options receive the very high ‘target frame’ value. .