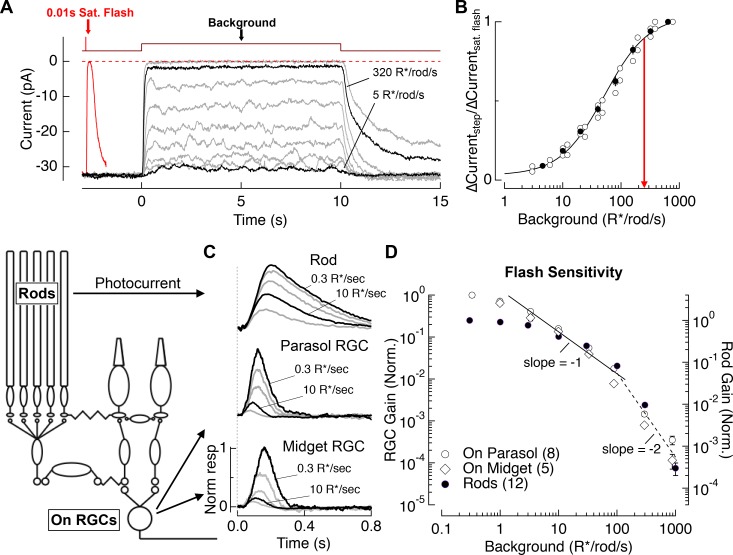
Figure 2. Evaluation of the range of rod signaling in phototransduction and in the retinal output.
(A) Direct recordings of photocurrent from rod outer segments (primate). Comparison of the responses to a short-wavelength saturating flash and a family of 10 s light steps or ‘backgrounds.’ (B) Current suppression, relative to saturation, plotted as a function of background luminance. Red arrow (250 R*/rod/s) indicates 90% saturation. (C) Gain of rod signals probed with short wavelength flashes on a range of rod adapting backgrounds in rod photoreceptors (top), On parasol RGCs (middle) and On Midget RGCs (bottom; traces are mean responses scaled by the flash strength in R*/rod, see Materials and methods). Gain is normalized to that measured at 0.3 R*/rod/s. (D) Population data for rod gain measurements in rod photoreceptors and ganglion cells. The solid line shows Weber behavior, and the dashed line highlights the steep drop in gain associated with rod saturation. Gain is normalized to that measured at 0.3 R*/rod/s.

