. 2018 Oct 9;7:e38281. doi: 10.7554/eLife.38281

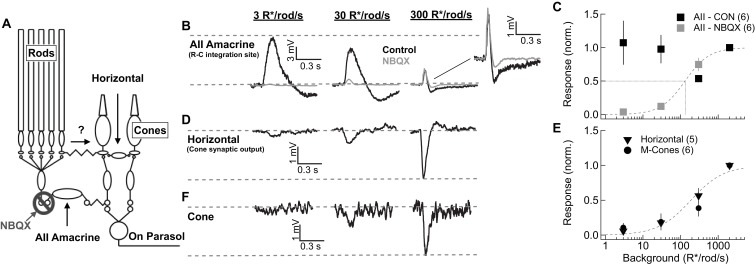
Figure 3. Comparison of rod signal strength in cells of the primary and secondary rod pathways (primate).

(A) Schematic of the primary and secondary rod pathways and action of the pharmacological manipulation used in the AII amacrine recordings. (B,D,F) Responses to short wavelength 600% contrast flashes across a range of rod backgrounds in AII amacrine cells, H1 horizontal cells, and M-cones. (B) Voltage responses of a current-clamped AII amacrine cell before (black) and during exposure to NBQX (10 µM). (C) Population data for AII amacrine recordings with and without NBQX. Responses are normalized by the response amplitude measured at 2000R*/rod/s. (D) Voltage responses of a current-clamped H1 horizontal cell. (E) Population data for H1 horizontal and M-cone recordings. Responses are normalized by the response amplitude measured at 2000 R*/rod/s. (F) Voltage responses of a M-cone recorded in the perforated-patch configuration.

Figure 3—source data 1. Excel spreadsheet with data for Figure 3C and E.
DOI: 10.7554/eLife.38281.011

Figure 3.

Figure 3—figure supplement 1. Rod signals in AII amacrine cells are blocked by NBQX (10 µM) at low light levels.

Figure 3—figure supplement 1.

Example current-clamp recording of scotopic and mesopic signaling in an AII amacrine cell. Flash responses in darkness were largely eliminated by bath application of NBQX. NBQX-insensitive responses emerged as flash strength was further increased. In the presence of dim (3 R*/rod/s) and moderate (30 R*/rod/s) backgrounds, stimuli that produce sub-saturating responses in the RGCs (scaled) are almost entirely blocked by NBQX in AII amacrines. At a background of 300 R*/rod/s (i.e. above rod saturation) flash responses in AIIs are largely insensitive to NBQX application.
Figure 3—figure supplement 2. Rod responses measured in cones.

Figure 3—figure supplement 2.

(A) Responses of a L cone to a family of brief 405 nm flashes producing from 15 to 1000 R*/cone. Inset shows an example of the rapid response originating in the cone outer segment and the long ‘tail’ associated with the response originating in the rod outer segment and conveyed to cones through rod-cone gap junctions (see Schneeweis and Schnapf, 1995). (B) Average response of the same cell as in A to a flash producing ~1 R*/rod (black). For comparison, the gray trace shows the scaled response from the inset in A. (C) Mean response squared and time-dependent variance (corrected for variance without a flash) for the same cell as A and B. Assuming the variance is dominated by Poisson fluctuations in photon absorption, the ratio between the mean response squared and the variance provides an estimate of the mean number of absorbed photons contributing to the response. In this cell, that corresponds to a single photon response of 0.022 mV. For six cells, the mean was 0.046 ± 0.007 (mean ± SEM), consistent with previous work (Hornstein et al., 2005).
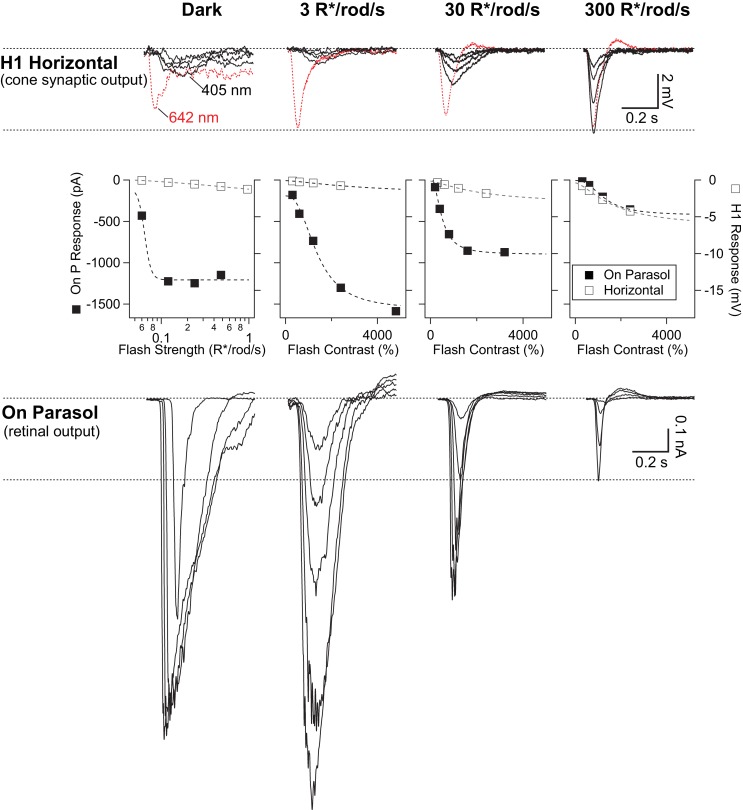
Figure 3—figure supplement 3. Rod signals are weak in H1 horizontal cells.

Figure 3—figure supplement 3.

Example recordings of a H1 horizontal cell (top row) and an On parasol RGC (bottom row) from the same retinal mount. As in Figure 3—figure supplement 1, short wavelength rod-preferring (and occasional long wavelength cone-preferring) flash responses were recorded across a range of scotopic and mesopic backgrounds. Rod signals in H1 horizontal cells were weak at low and intermediate backgrounds, despite the cells’ robust responses to long wavelength stimuli. At 300 R*/rod/s, long and short wavelength stimuli evoked responses with similar kinetics, suggesting they both arise from cones. On parasol RGC responses, however, were largest at the dimmest light levels. At 300 R*/rod/s, responses in On parasols had kinetics that were similar to those observed in horizontal cells. Right and left ordinate axes on the middle plots are scaled such the RGC and H1 responses are matched at 300 R*/rod/s (a background at which signals are dominated by cone activity).